When it’s hot, it’s hot for everyone. And across all cities, extreme temperatures will continue to grow in both severity and frequency.1–3 Much prior research has shown that vulnerable communities experience the adverse health effects of extreme heat “first and worst” - these are referred to as frontline communities.4–6 Frontline communities can include populations who historically and continuously face “economic disinvestment, under-investment, and [sociopolitical] disenfranchisement,” leading to environments and infrastructure less prepared for extreme heat, reduced capacity to pay for heat adaptation measures such as air conditioning, and chronic conditions that can lead to higher risk of heat-related illness and death.4,7,8 Many factors can affect whether one is more at risk from extreme heat exposure, ranging from high temperatures to age to occupation. Yet, how do we define who is vulnerable to extreme heat, and how can we identify where frontline communities are located to better target extreme heat interventions?
The figure below informs this project’s approach to vulnerability, translating the Intergovernmental Panel on Climate Change’s (IPCC’s) 2007 definition of climate vulnerability10 to fit within the context of urban extreme heat9. To summarize, exposure describes the distribution and severity of extreme temperatures as well as land use considerations such as tree canopy coverage; sensitivity is the inability of a population to absorb impacts or shocks without long-term harm; and, adaptive capacity refers to the ability of a population to modify lifestyles and behaviors as a means to cope with ongoing or anticipated heat stresses9(p3),10.
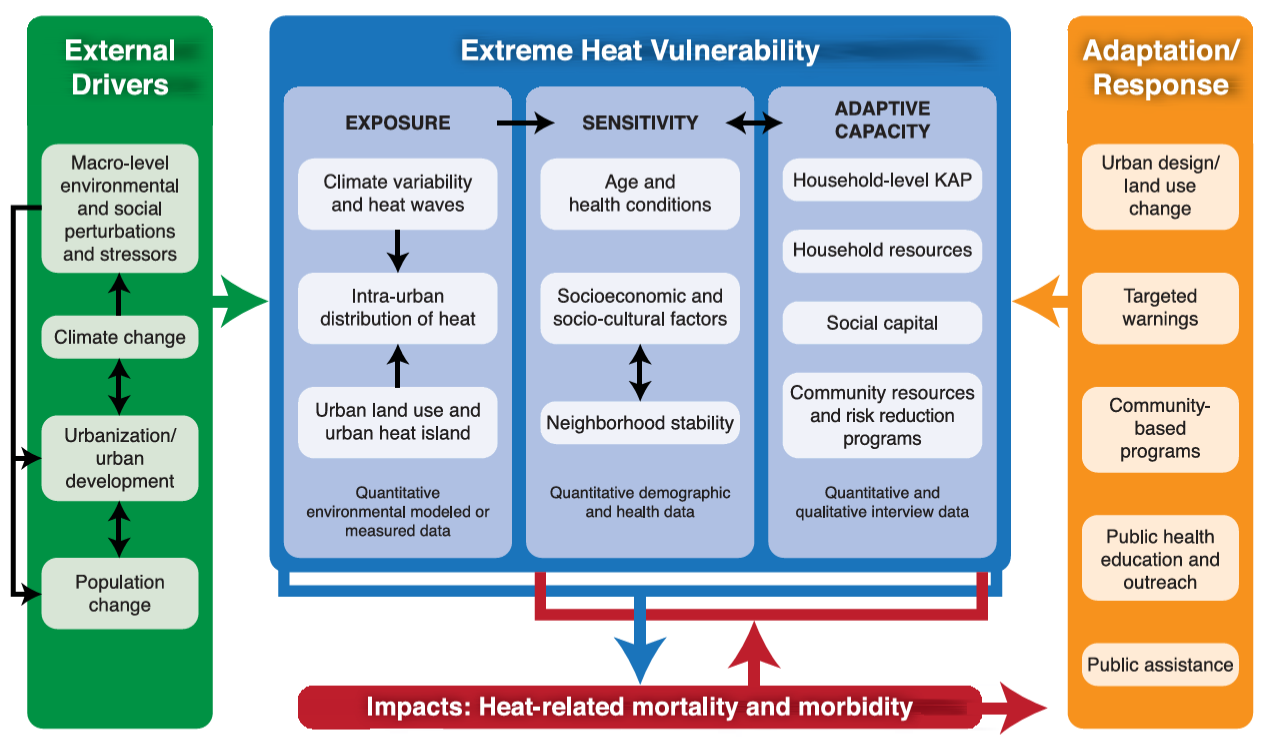
This figure was adapted from the IPCC framework (2007) by Wilhelmi and Hayden9.
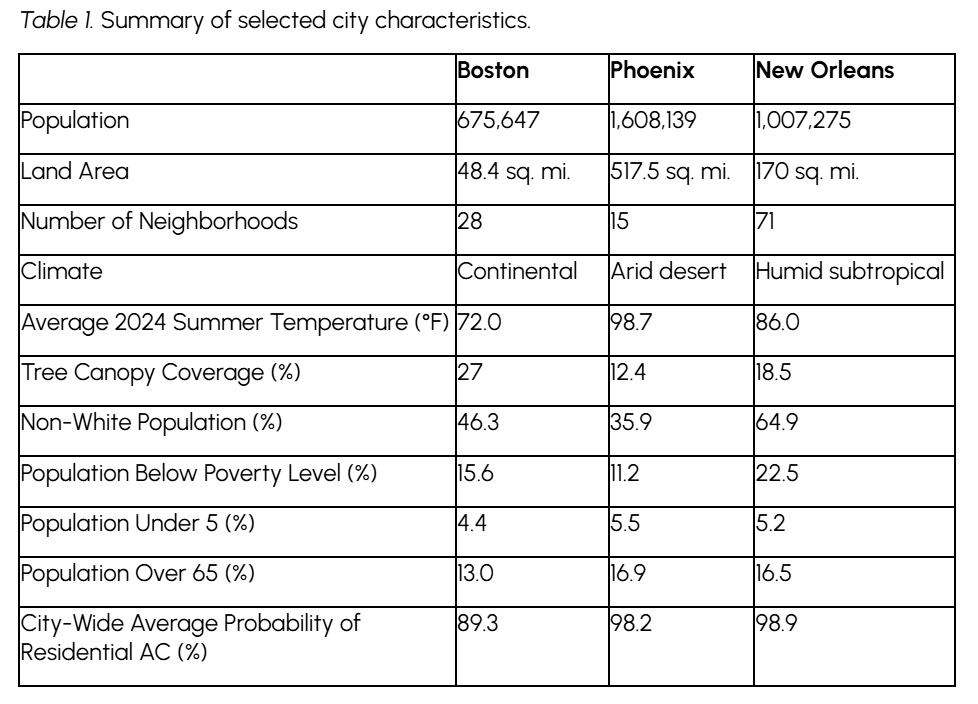
First, let’s zoom out and understand a bit more about the three cities of interest. Below is a table showing some selected characteristics of Boston, Phoenix, and New Orleans (Table 1). Most of these characteristics - for example, tree canopy coverage, poverty status, and being 65 + - are considered vulnerabilities to extreme heat in the existing literature11–13. Phoenix holds the largest population, the smallest tree canopy coverage, and the hottest average 2024 summer temperature. New Orleans, with its unique structure dividing the city into 73 neighborhoods, has the largest number of non-white and low-income households. Boston, the geographically smallest city, has the lowest probability of residential AC yet the highest tree canopy coverage. These cities are quite diverse in their environmental, climate and socio-demographic landscapes, creating unique challenges for policymakers when tailoring strategies to address extreme heat.
Cities also have to consider how the urban built environment contributes to the extreme temperatures that residents face. Less green space and more building complexes made of heat-absorbent materials can result in a deadly combination of “higher temperatures but lower access to cooling.”14(p4) This stark difference in temperatures between urban built environments and their non-urban counterparts is often referred to as the urban heat island (UHI) effect.15 Figure 2 compares the percentage and counts of people exposed to the UHI effect in the three cities. While New Orleans has the highest proportion of the population living in UHIs, Phoenix has the largest number of people affected, nearing 900,000 residents. This highlights how differences in population size should inform the scale and scope of extreme heat interventions.
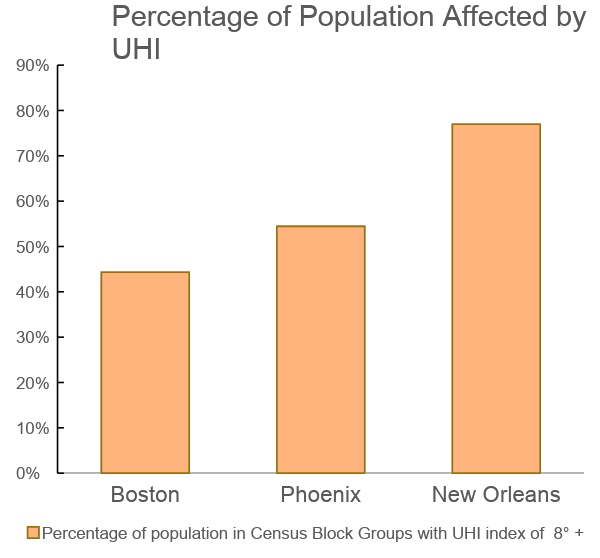
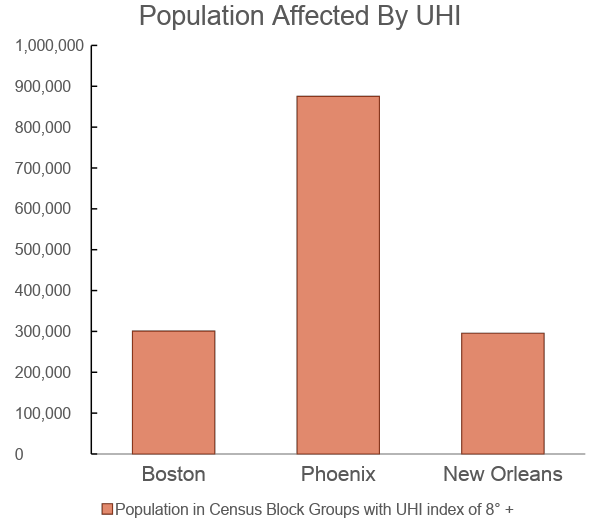
Data above are pulled from ClimateCentral.org. For these data, UHI index values (in °F) are "estimates of how much the urban built environment boosts temperatures. In other words, the UHI index is an estimate of the additional heat that local land use factors contribute to urban areas."
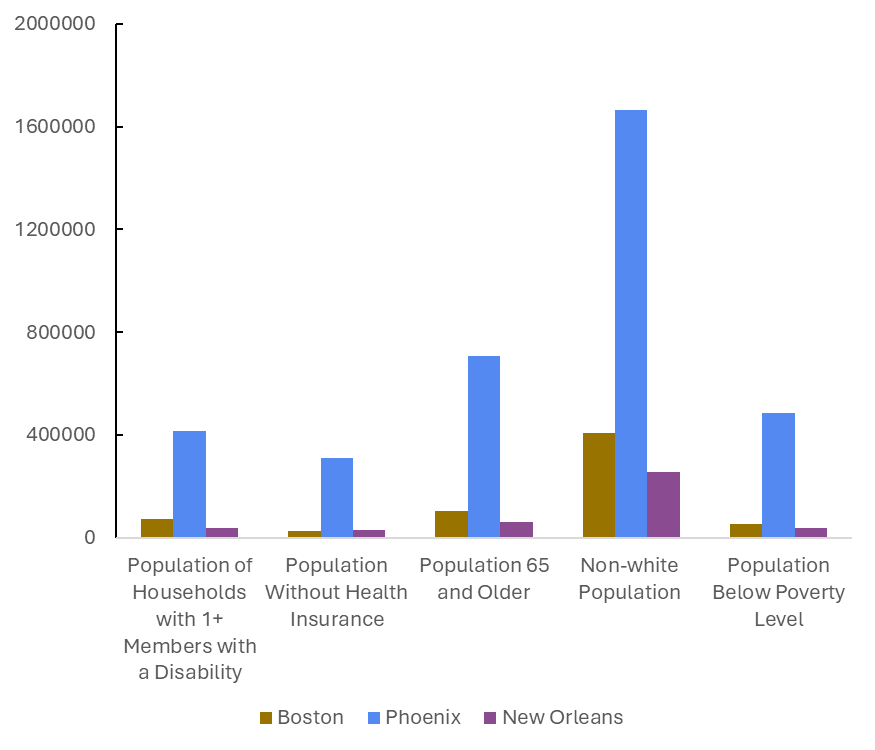
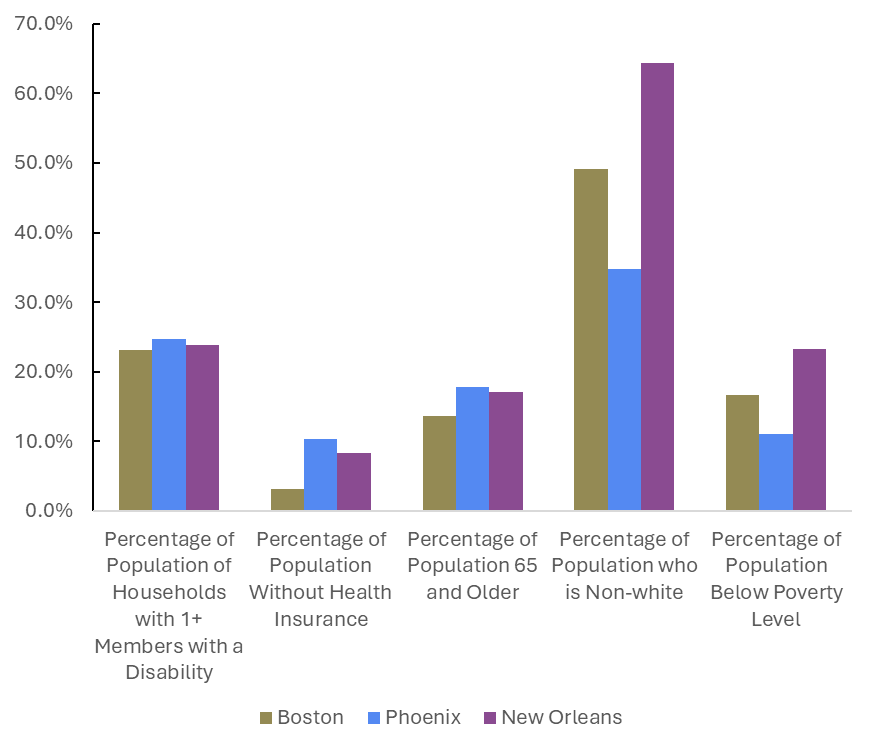
While UHI can be considered an exposure-based vulnerability, Boston, Phoenix, and New Orleans additionally vary in the sensitivity and lack of adaptive capacity vulnerabilities experienced by residents. Figure 3 graphs some of the sociodemographic characteristics shown in Table 1. Phoenix had the largest population counts for all vulnerabilities. However, New Orleans had the highest proportion of residents who are non-white and living below the poverty level, and Phoenix ranked last across both demographic metrics. All three cities had similar proportions of households with a member with a disability, and residents who are 65+ years old.
In order to map exposure, sensitivity, and adaptive capacity, indices were first created for each of these categories. Table 2 shows the variables included in the exposure, sensitivity, and lack of adaptive capacity indices. The scope was narrowed to vulnerabilities with data available at the census tract, or ideally block group, level. A full repository of all maps, including block groups, can be found in the appendix.
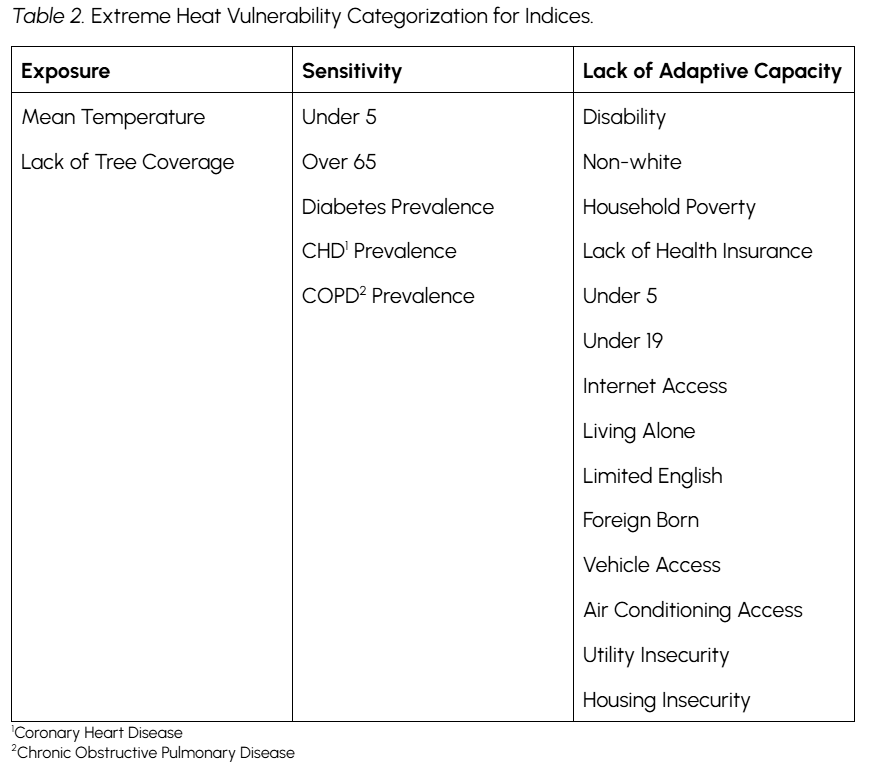
These index groupings were used to calculate the percentage of census tracts (small geographic units of analysis) that have high vulnerability for at least one of the variables within the category. High vulnerability refers to whether a census tract falls within the 90th percentile for a given variable as compared to other census tracts in the city. Every census tract was flagged as “high” or “low” vulnerability for each exposure, sensitivity, and lack of adaptive capacity index. These flags were used to understand the percentage of each neighborhood that had high vulnerability for a given index.
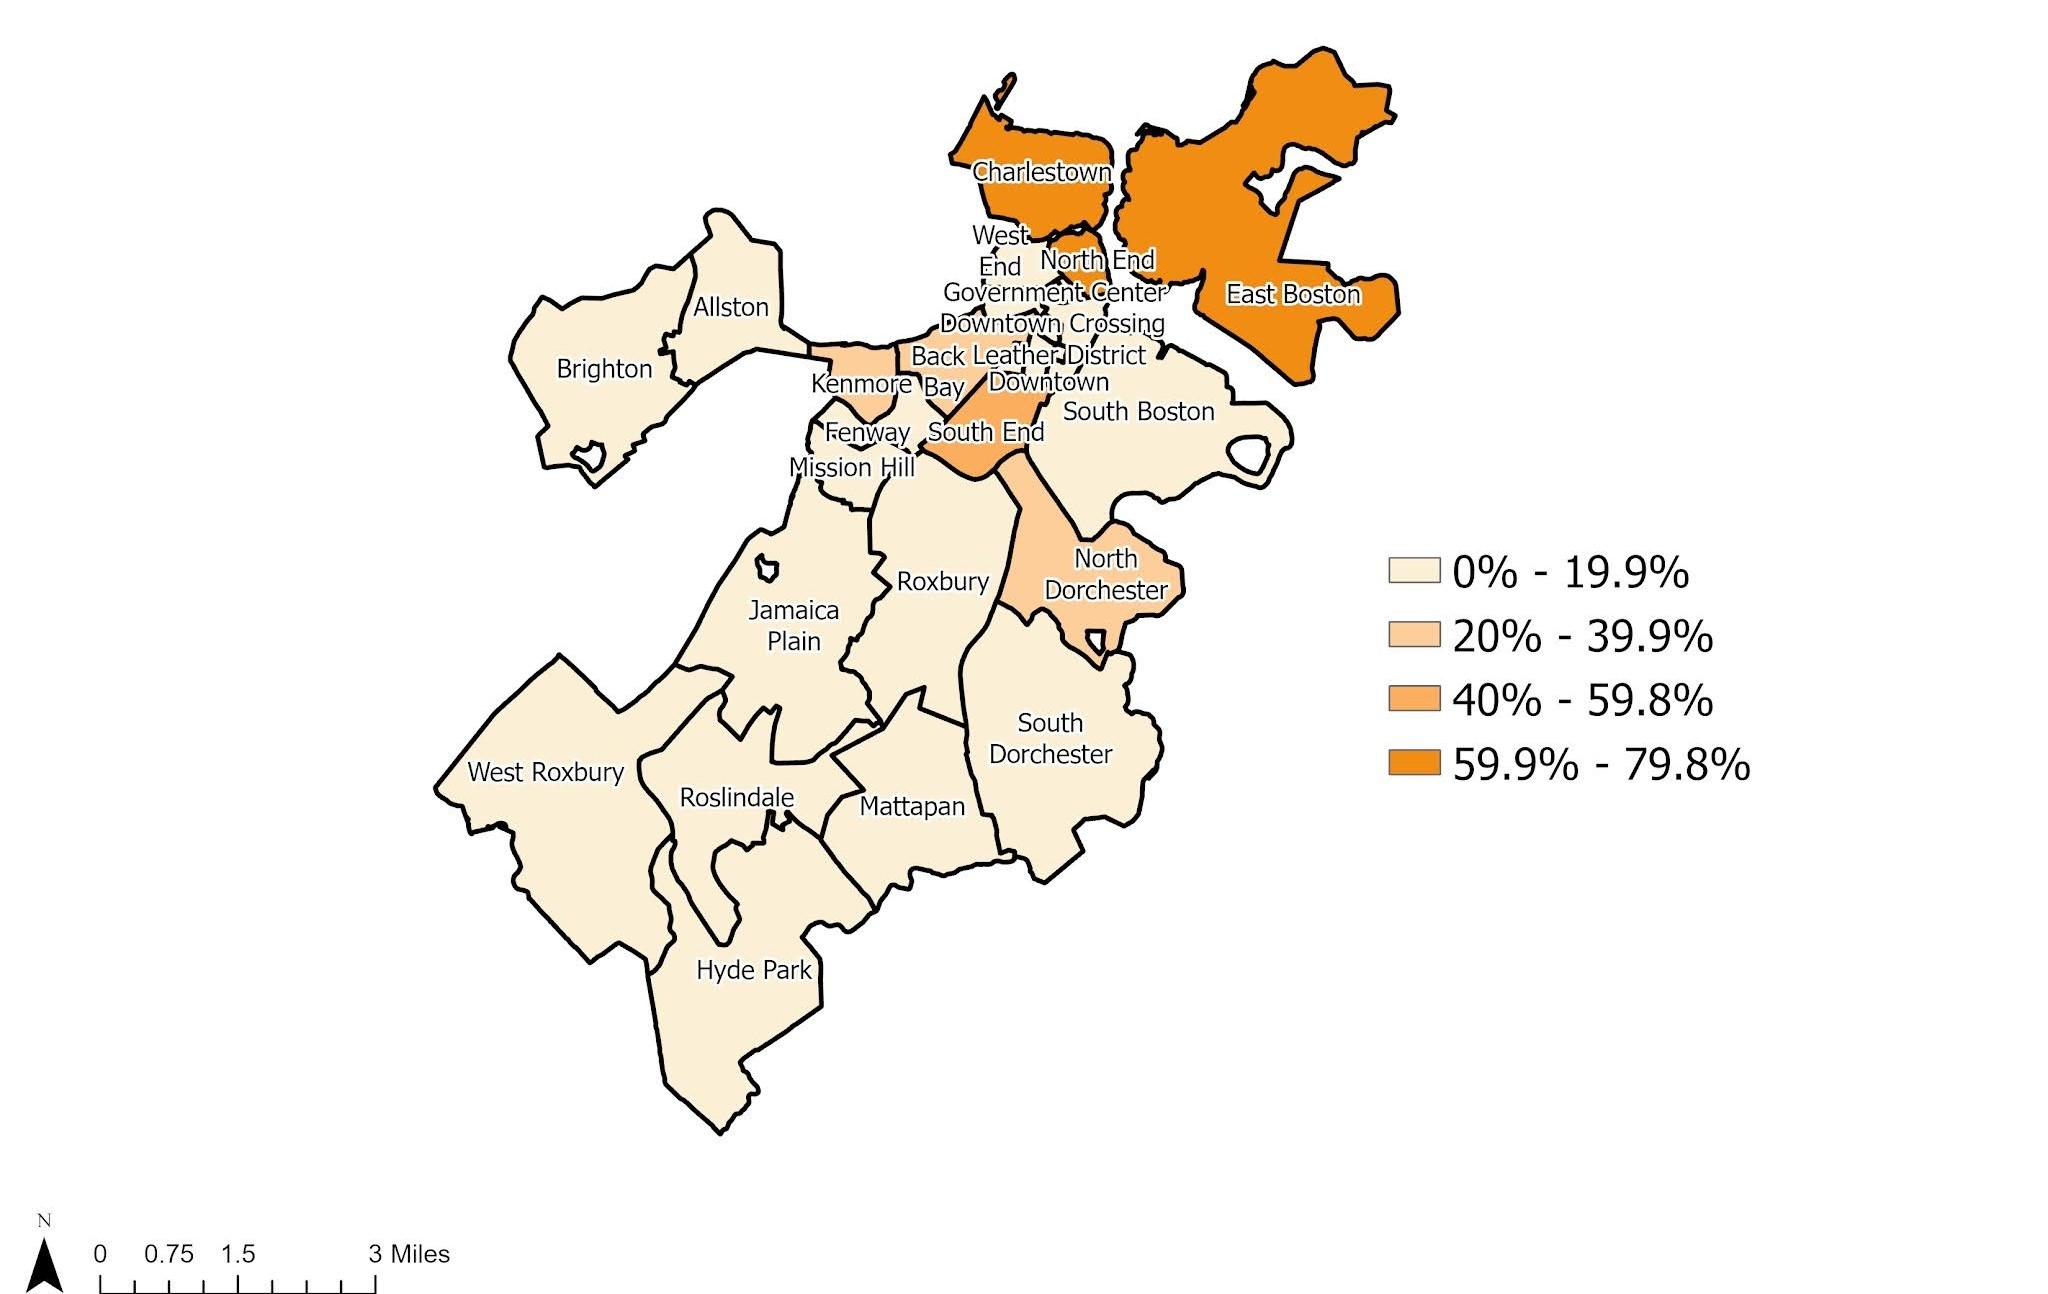
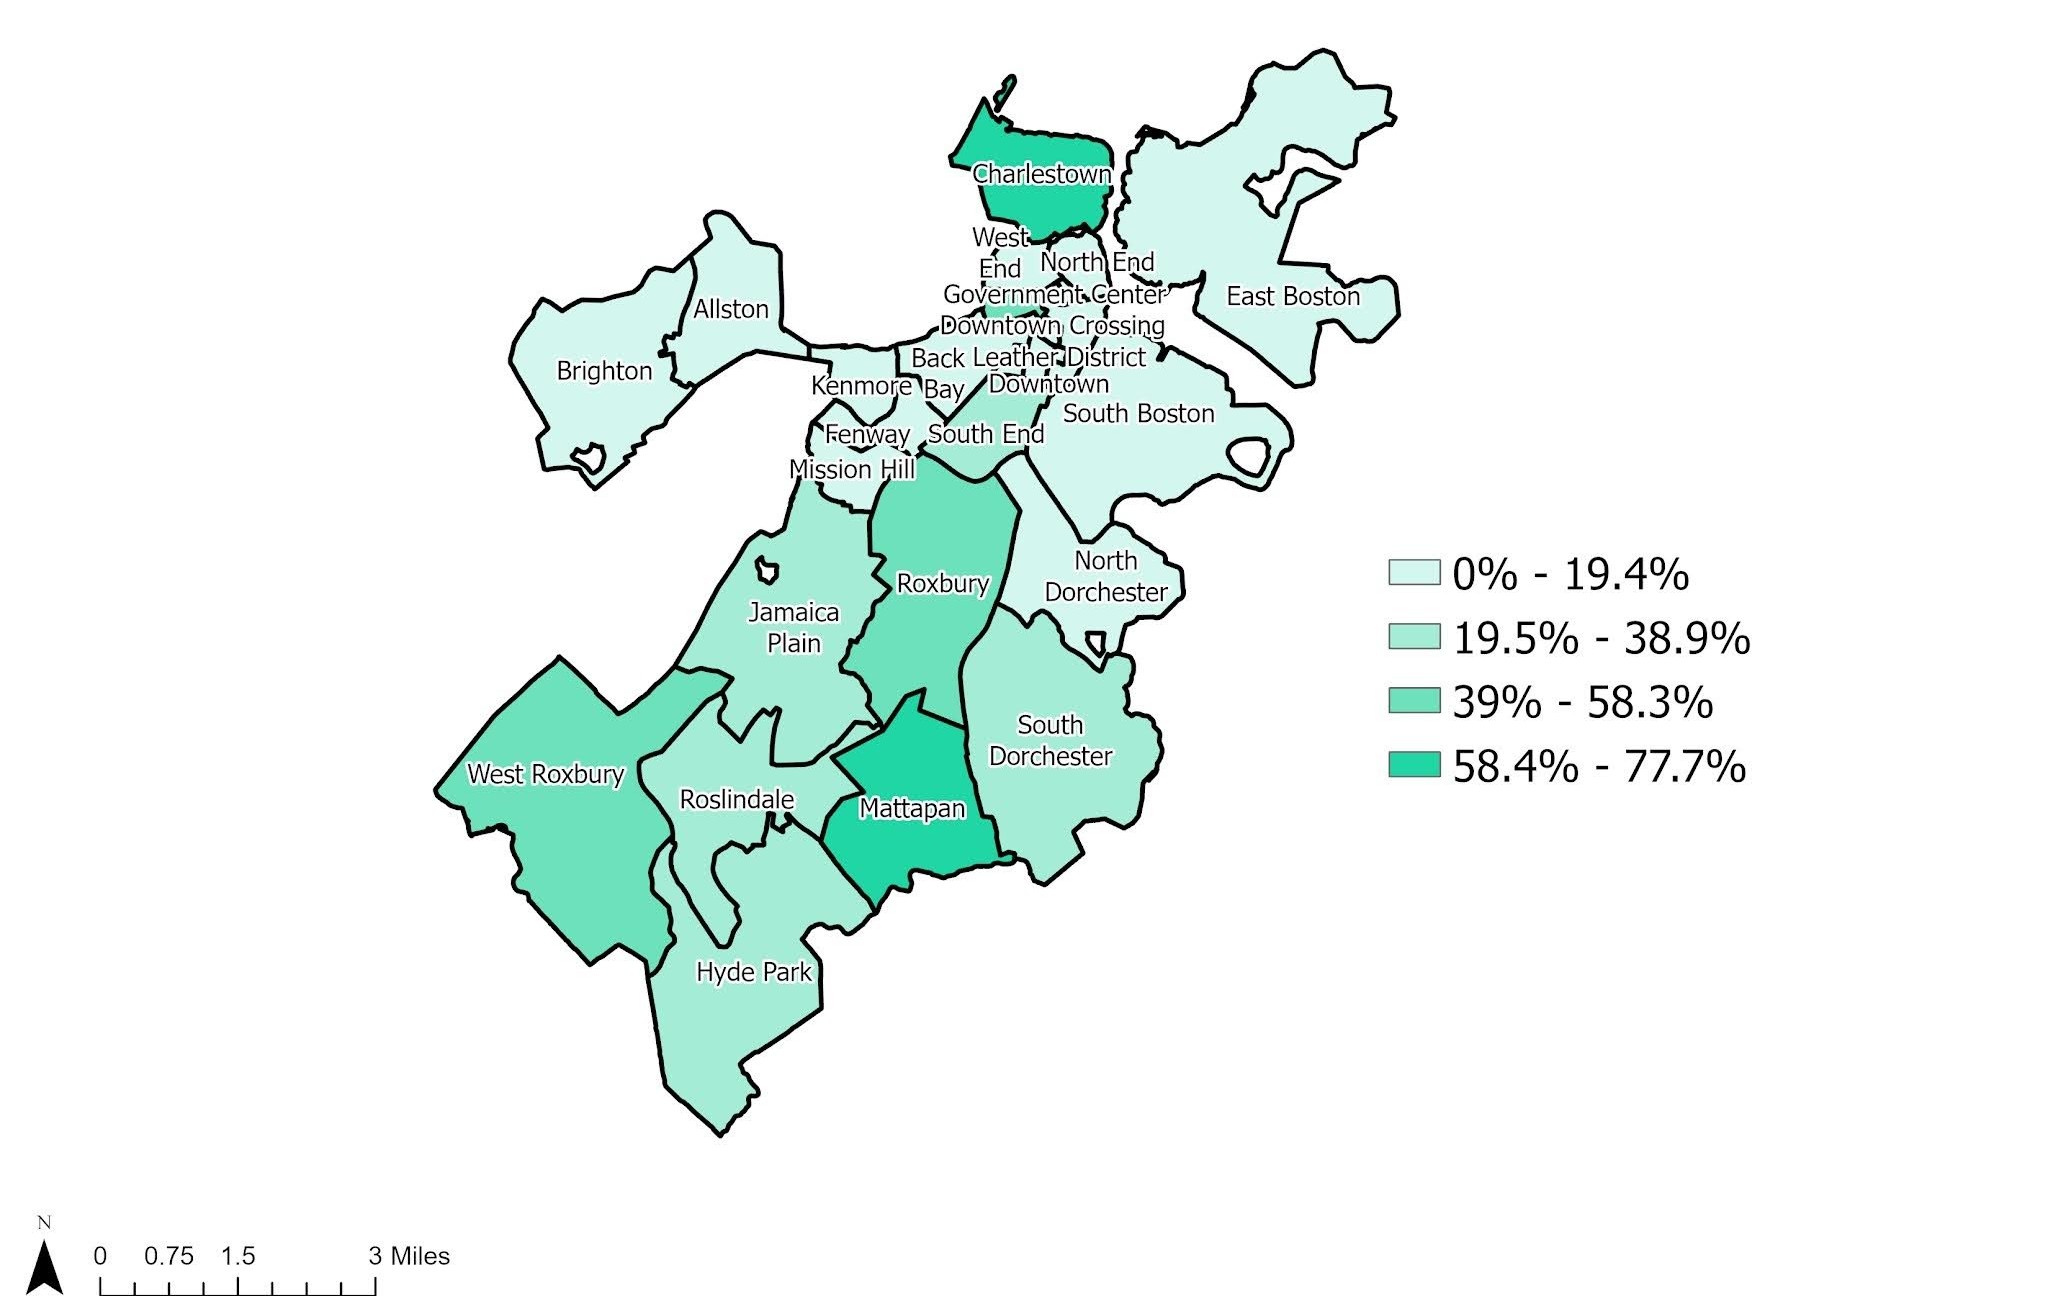
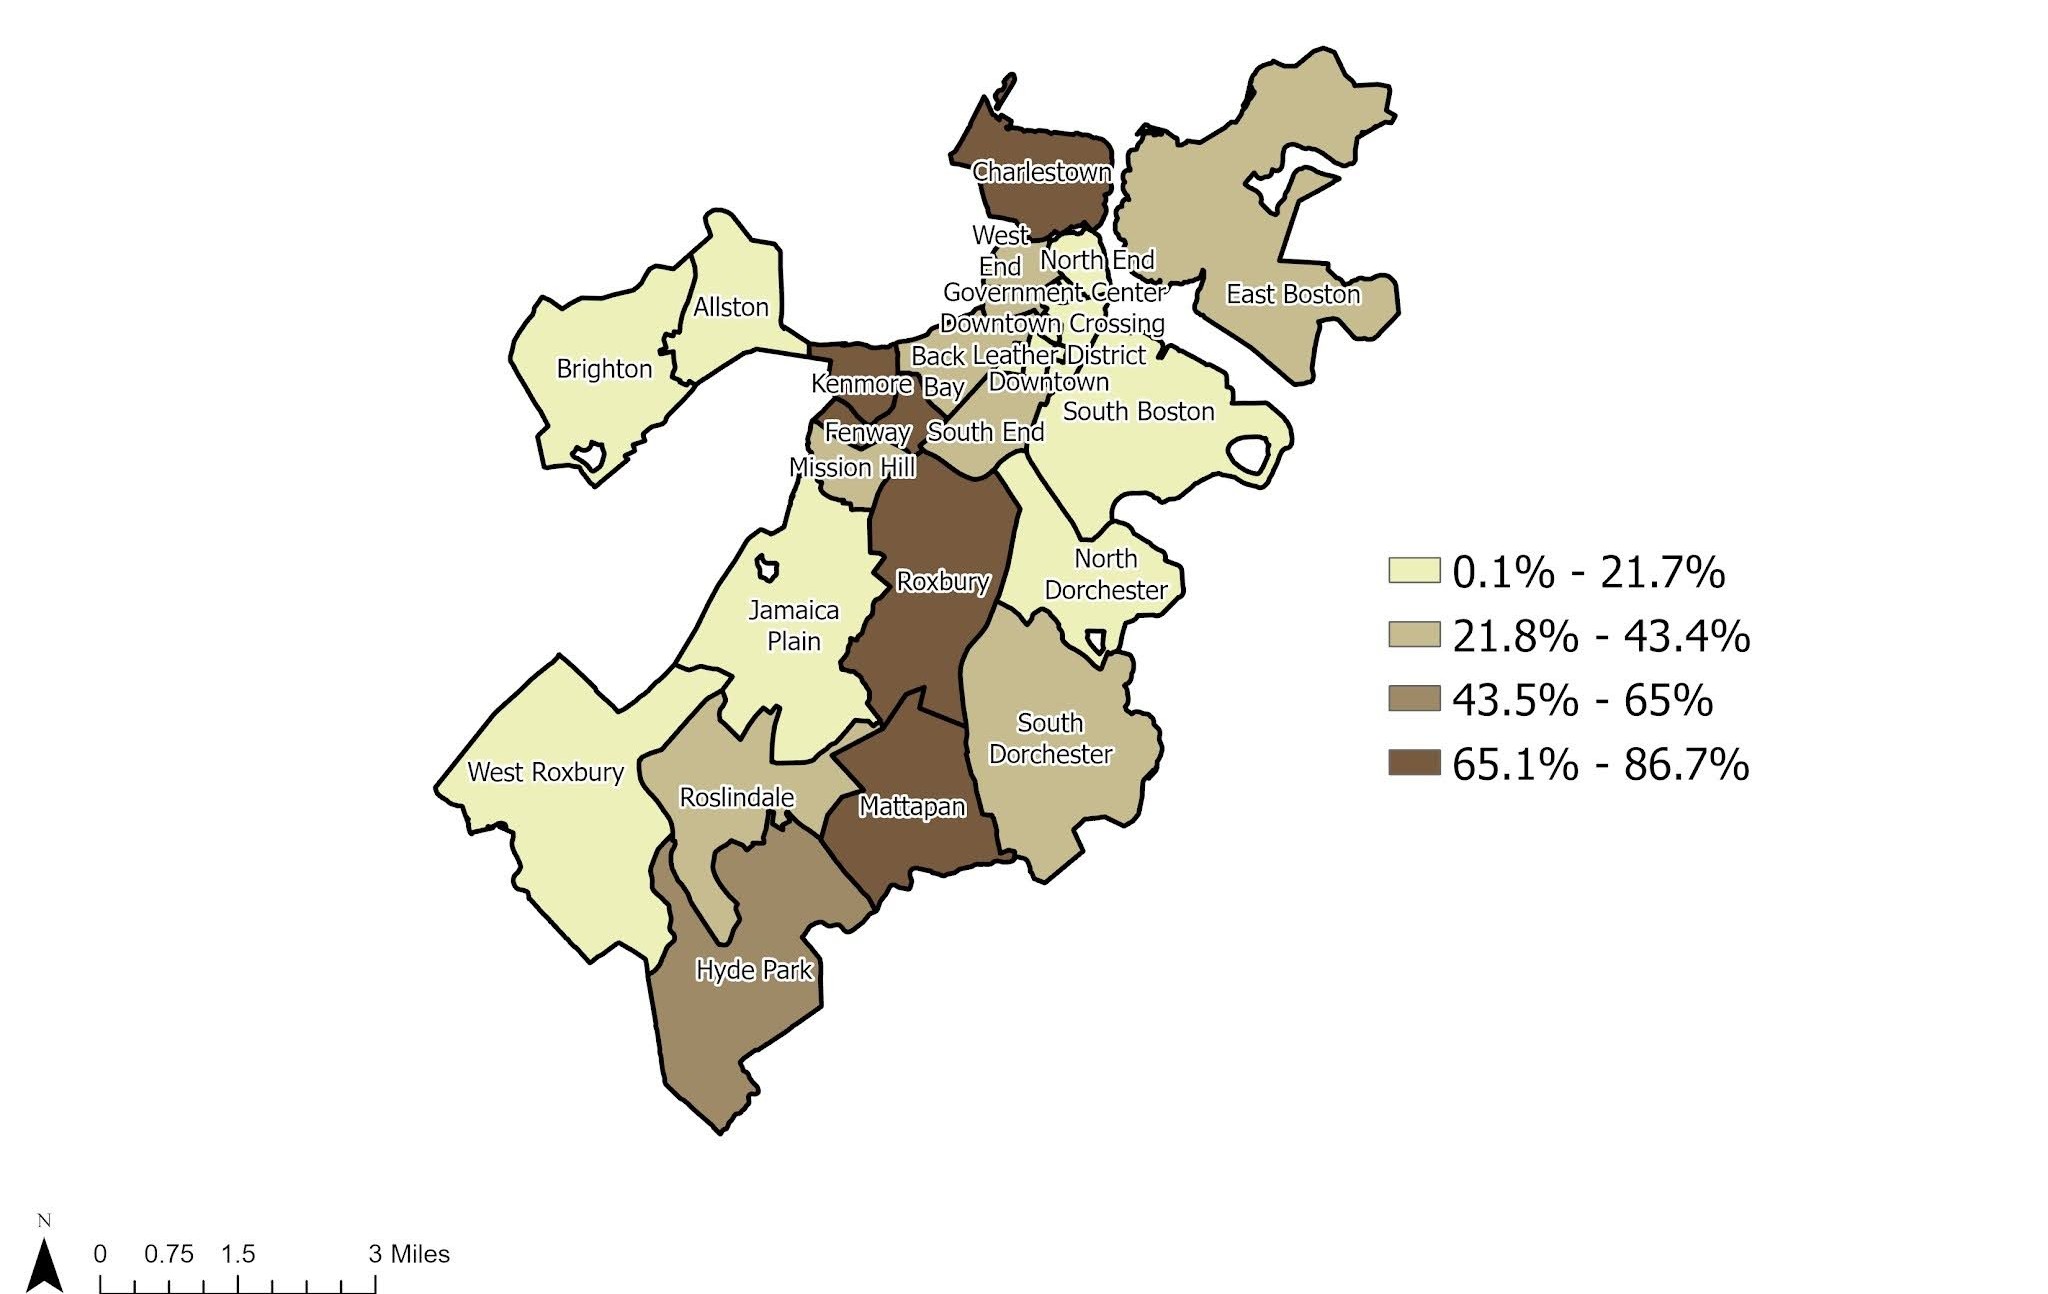
Figure 4 shows maps of the three indices - exposure, sensitivity and lack of adaptive capacity - within Boston’s neighborhoods. Southern neighborhoods in Boston, including South Dorchester, Roxbury, and Jamaica Plain, showed high proportions of vulnerability from sensitivity and lack of adaptive capacity. Charlestown was highlighted for all three categories.
Based on these findings, frontline neighborhoods for Boston were considered to be Charlestown, East Boston, Roxbury, Mattapan, South Dorchester, and Downtown. Interestingly, these areas align somewhat, yet not exactly, with the neighborhoods identified in the Boston Heat Resilience Solutions report:1 Chinatown, Dorchester, East Boston, Mattapan, and Roxbury. Roxbury and Mattapan especially showed high vulnerability to sensitivity and lack of adaptive capacity, however North Dorchester was not especially high risk for any of the three indices. This could be due to socio-historic factors or community input that could not be captured in this project.
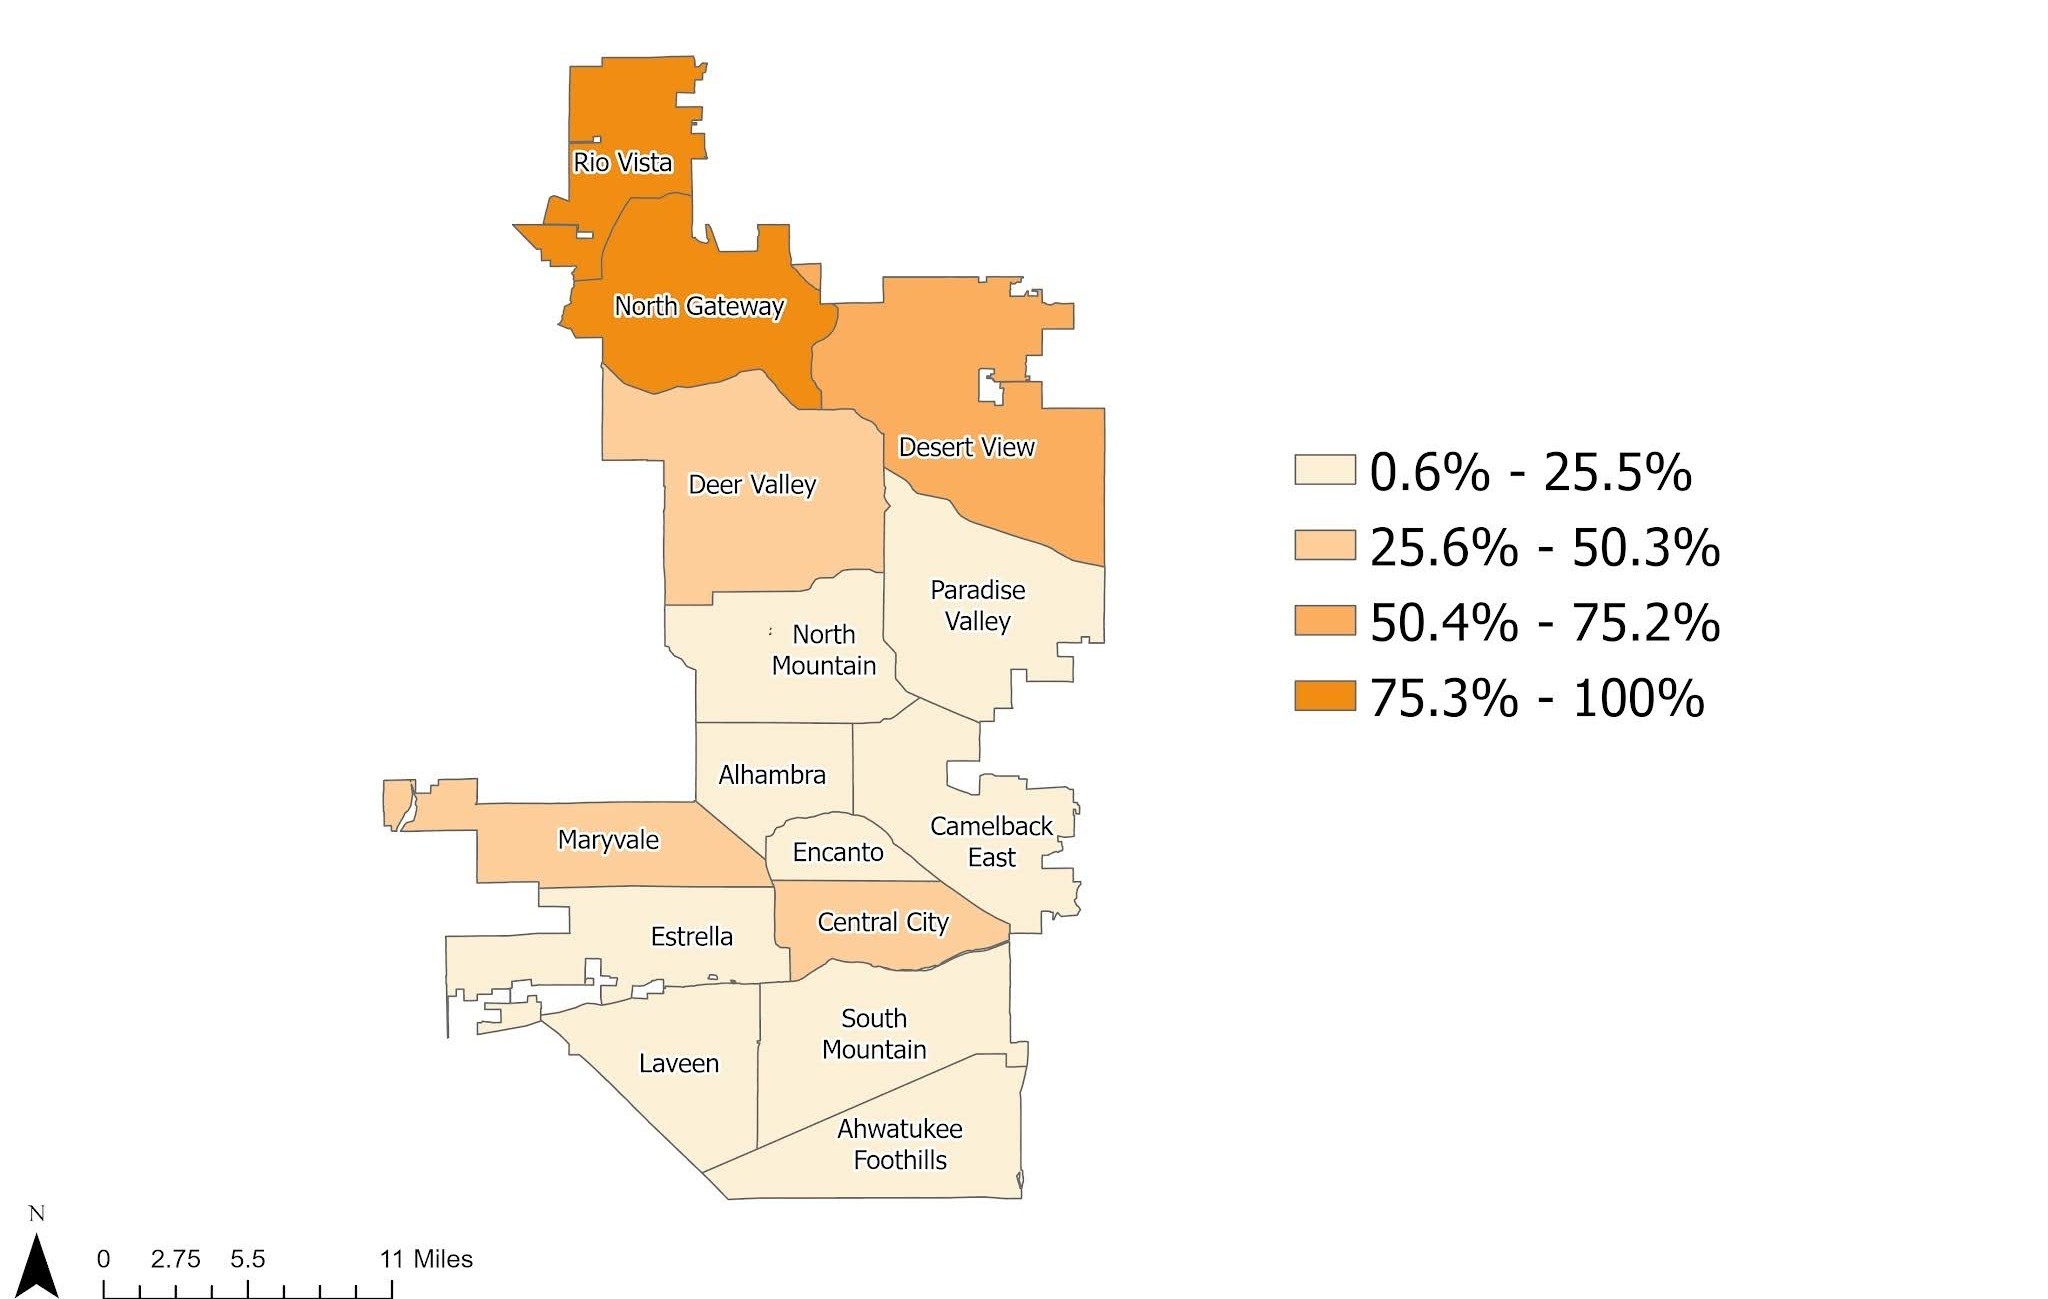
Similar to Boston, heat vulnerability within Phoenix was centralized around the downtown areas, with additional patterns of vulnerability in the northern neighborhoods. It is important to note Phoenix’s size and population (Table 1.), making this the geographically and demographically largest site. 40% of neighborhoods (6 of 15) had at least three-quarters of census tracts with high lack of adaptive capacity vulnerability.
Rio Vista, Desert View, Central City, South Mountain, Maryville, and Estrella were classified as frontline neighborhoods for Phoenix. While the City of Phoenix has not shared any focus neighborhoods, its 2017 Heat Action Planning Guide had identified communities in South Mountain and Central City as part of a study with residents vulnerable to extreme heat health risks.16 The aforementioned neighborhoods are mostly located near the downtown area with the exception of Rio Vista and Desert View. Desert View especially is a neighborhood facing high vulnerability, with high proportions of vulnerable populations across all three indices.
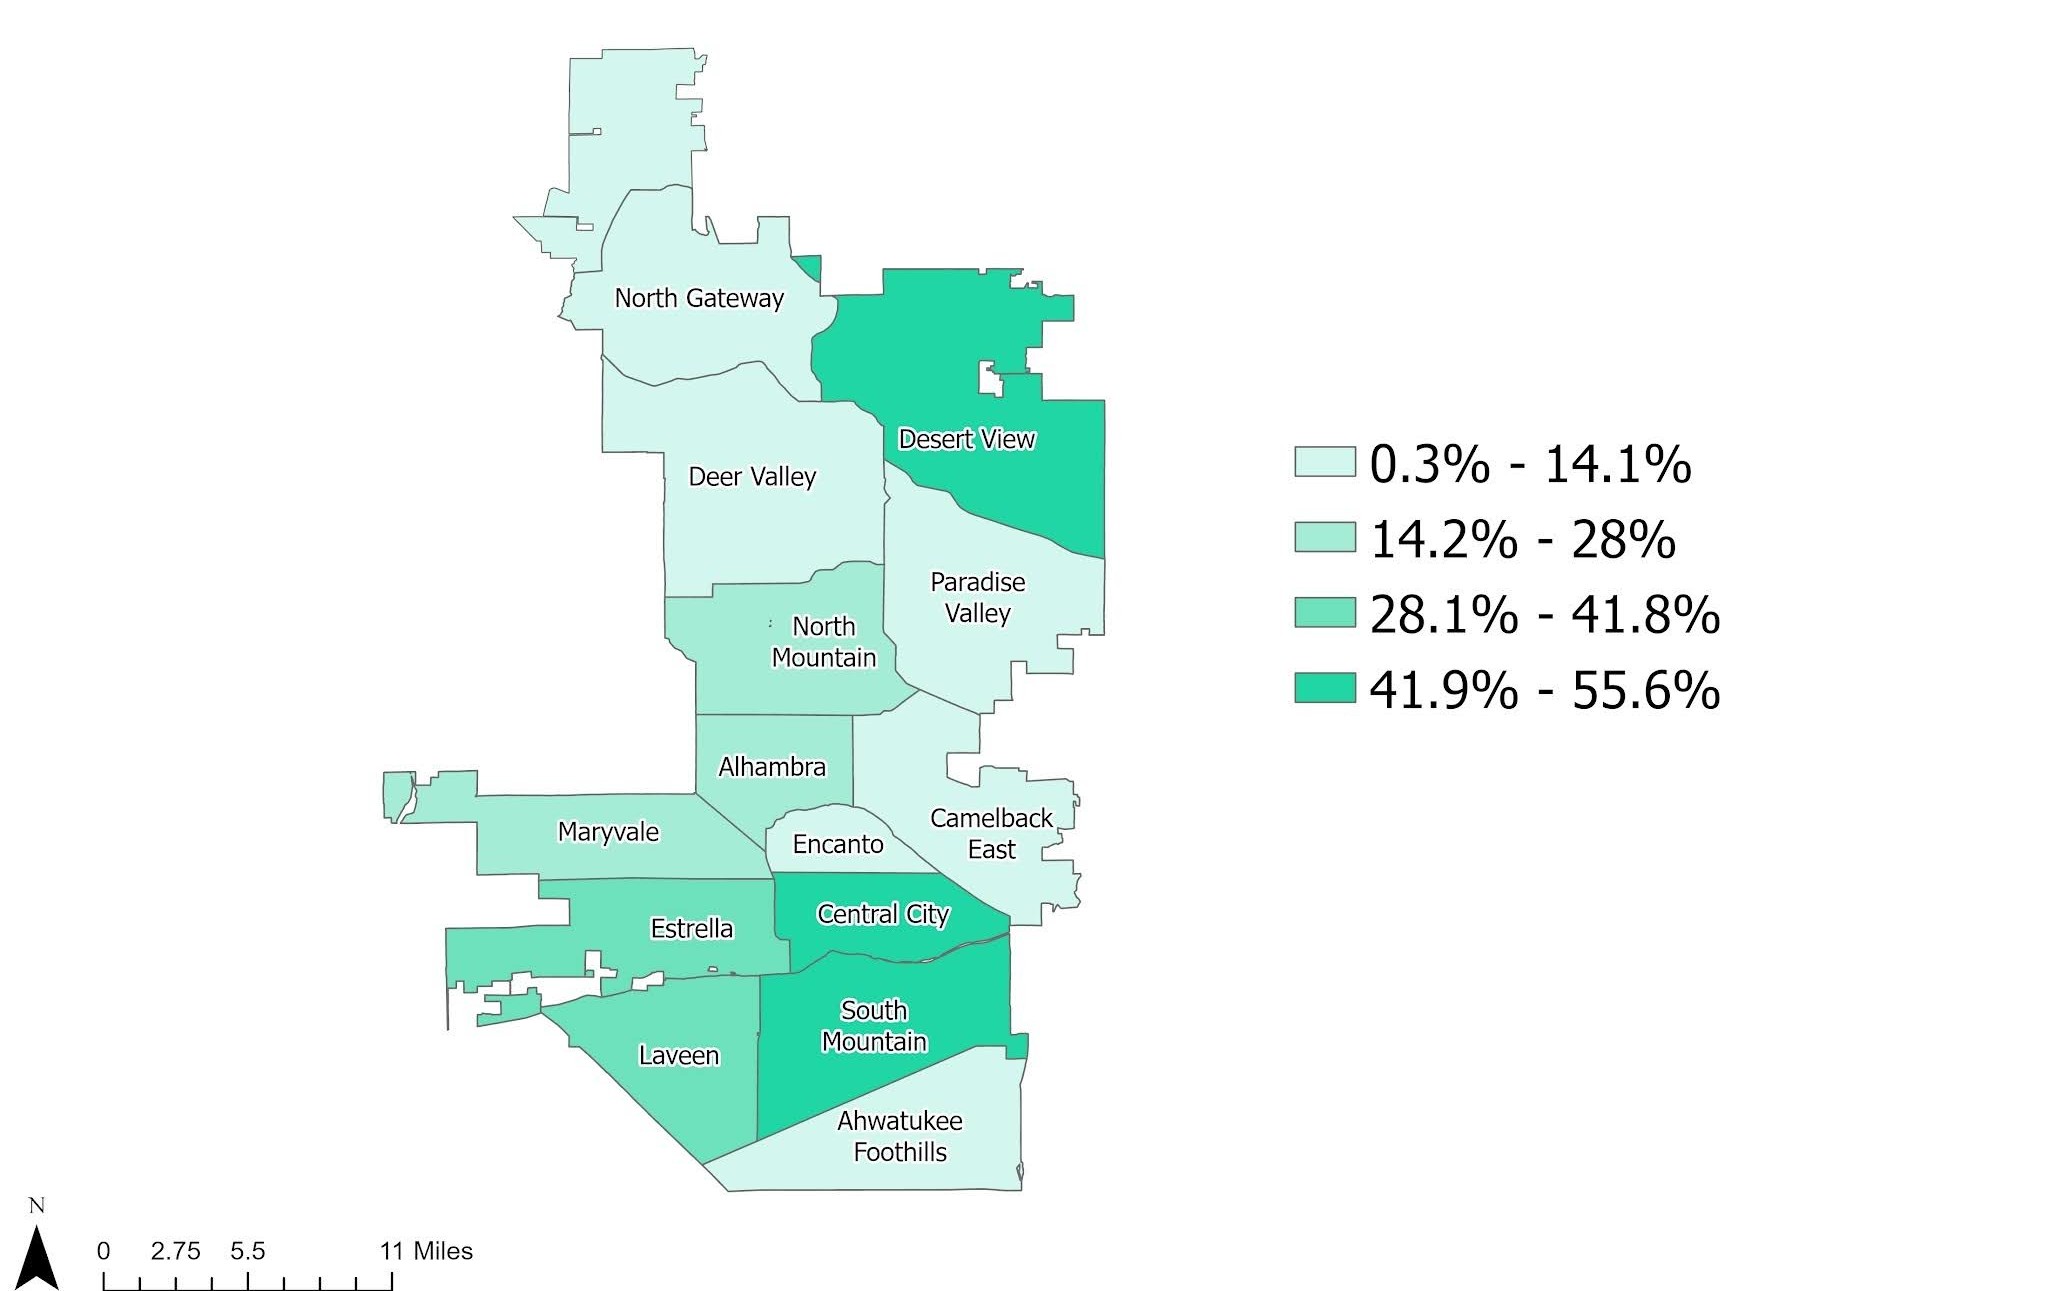
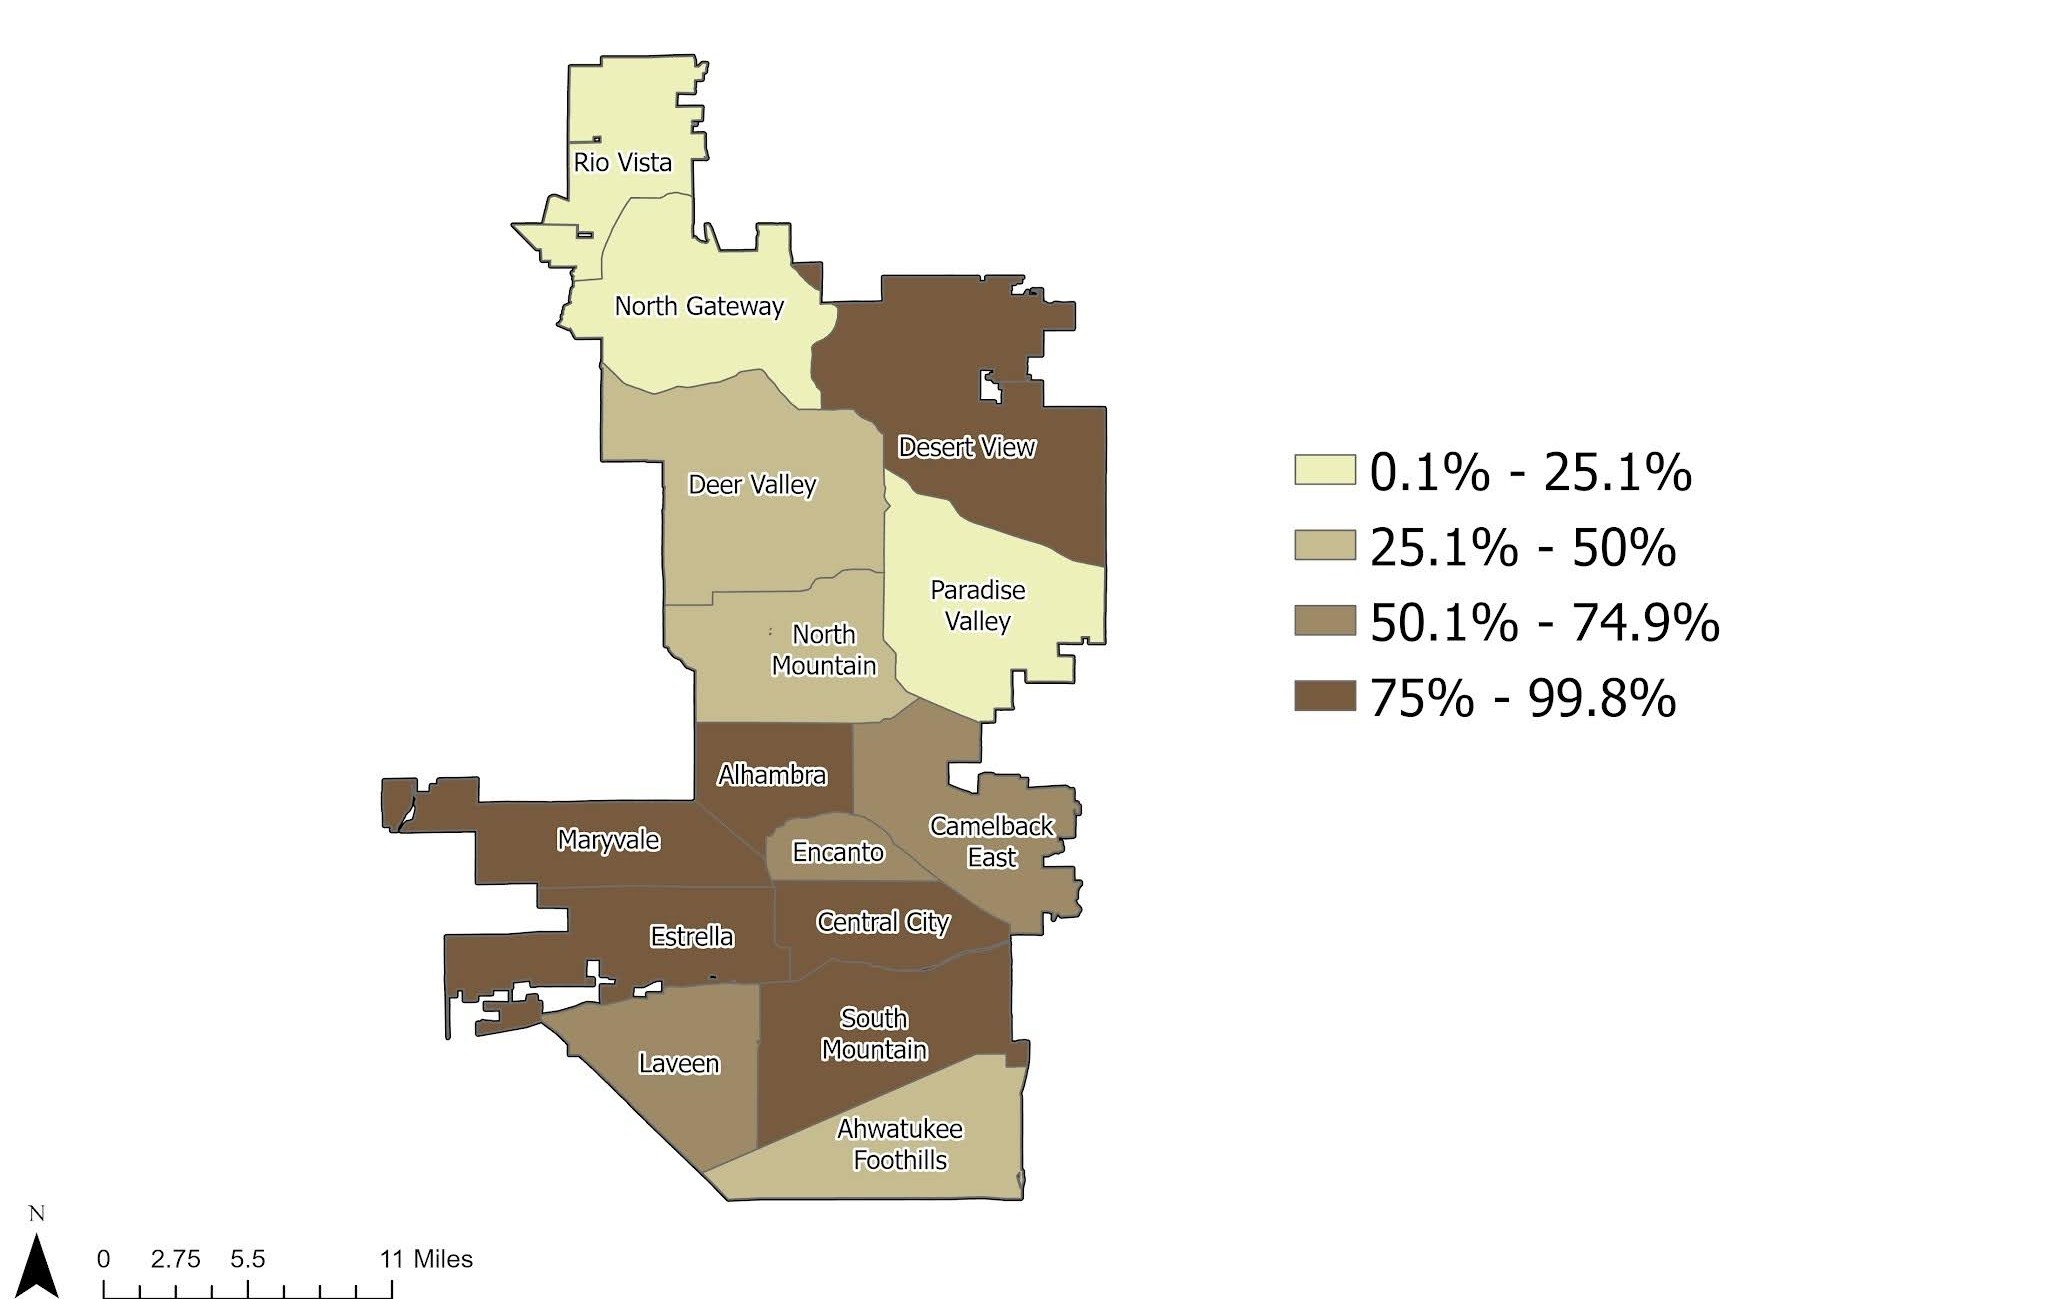
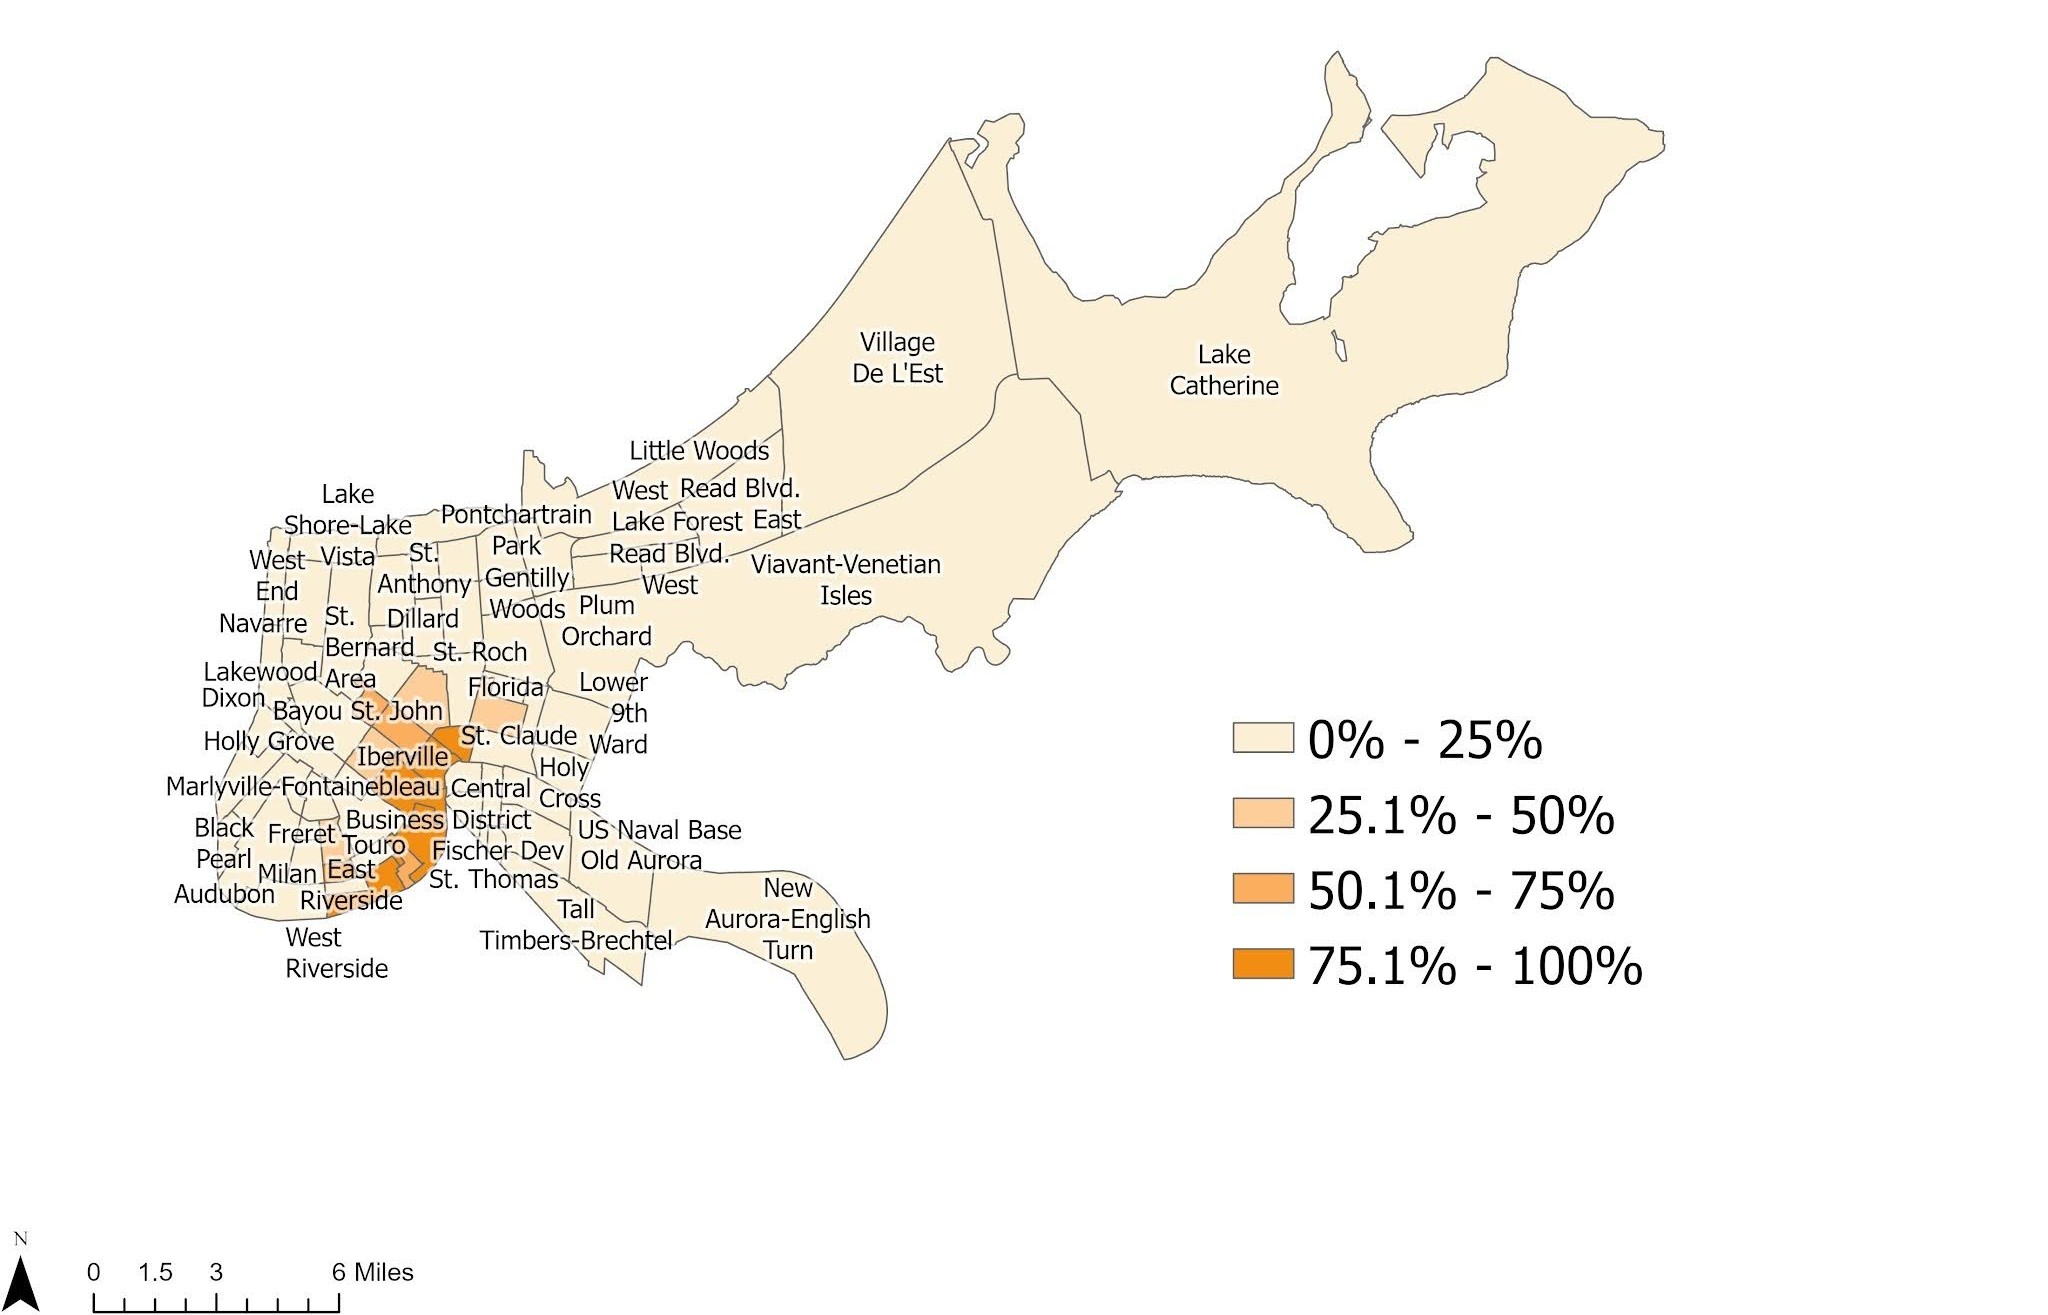
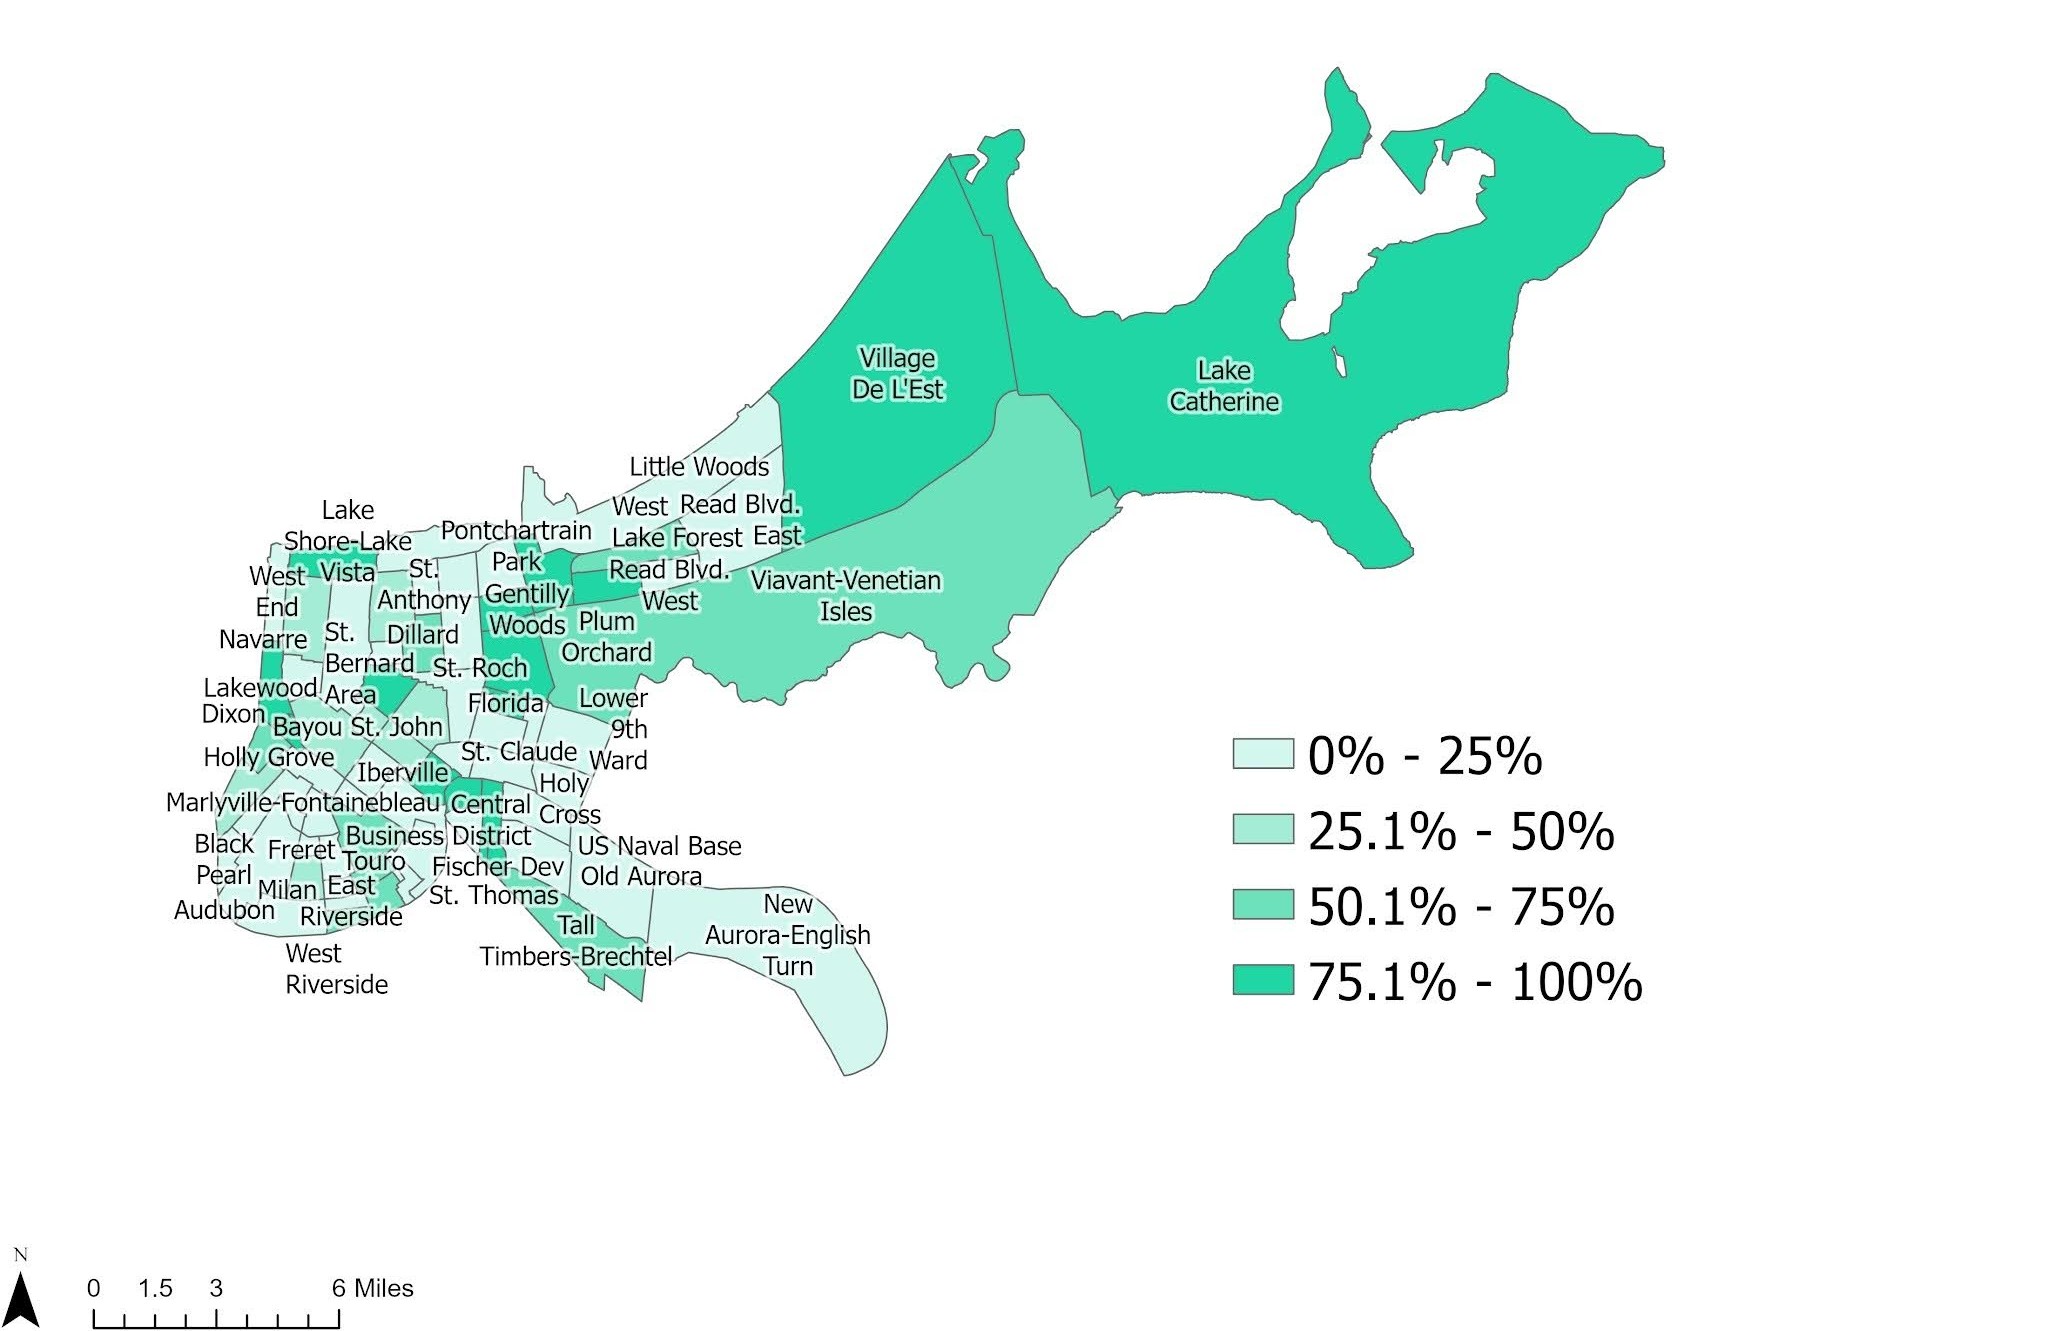
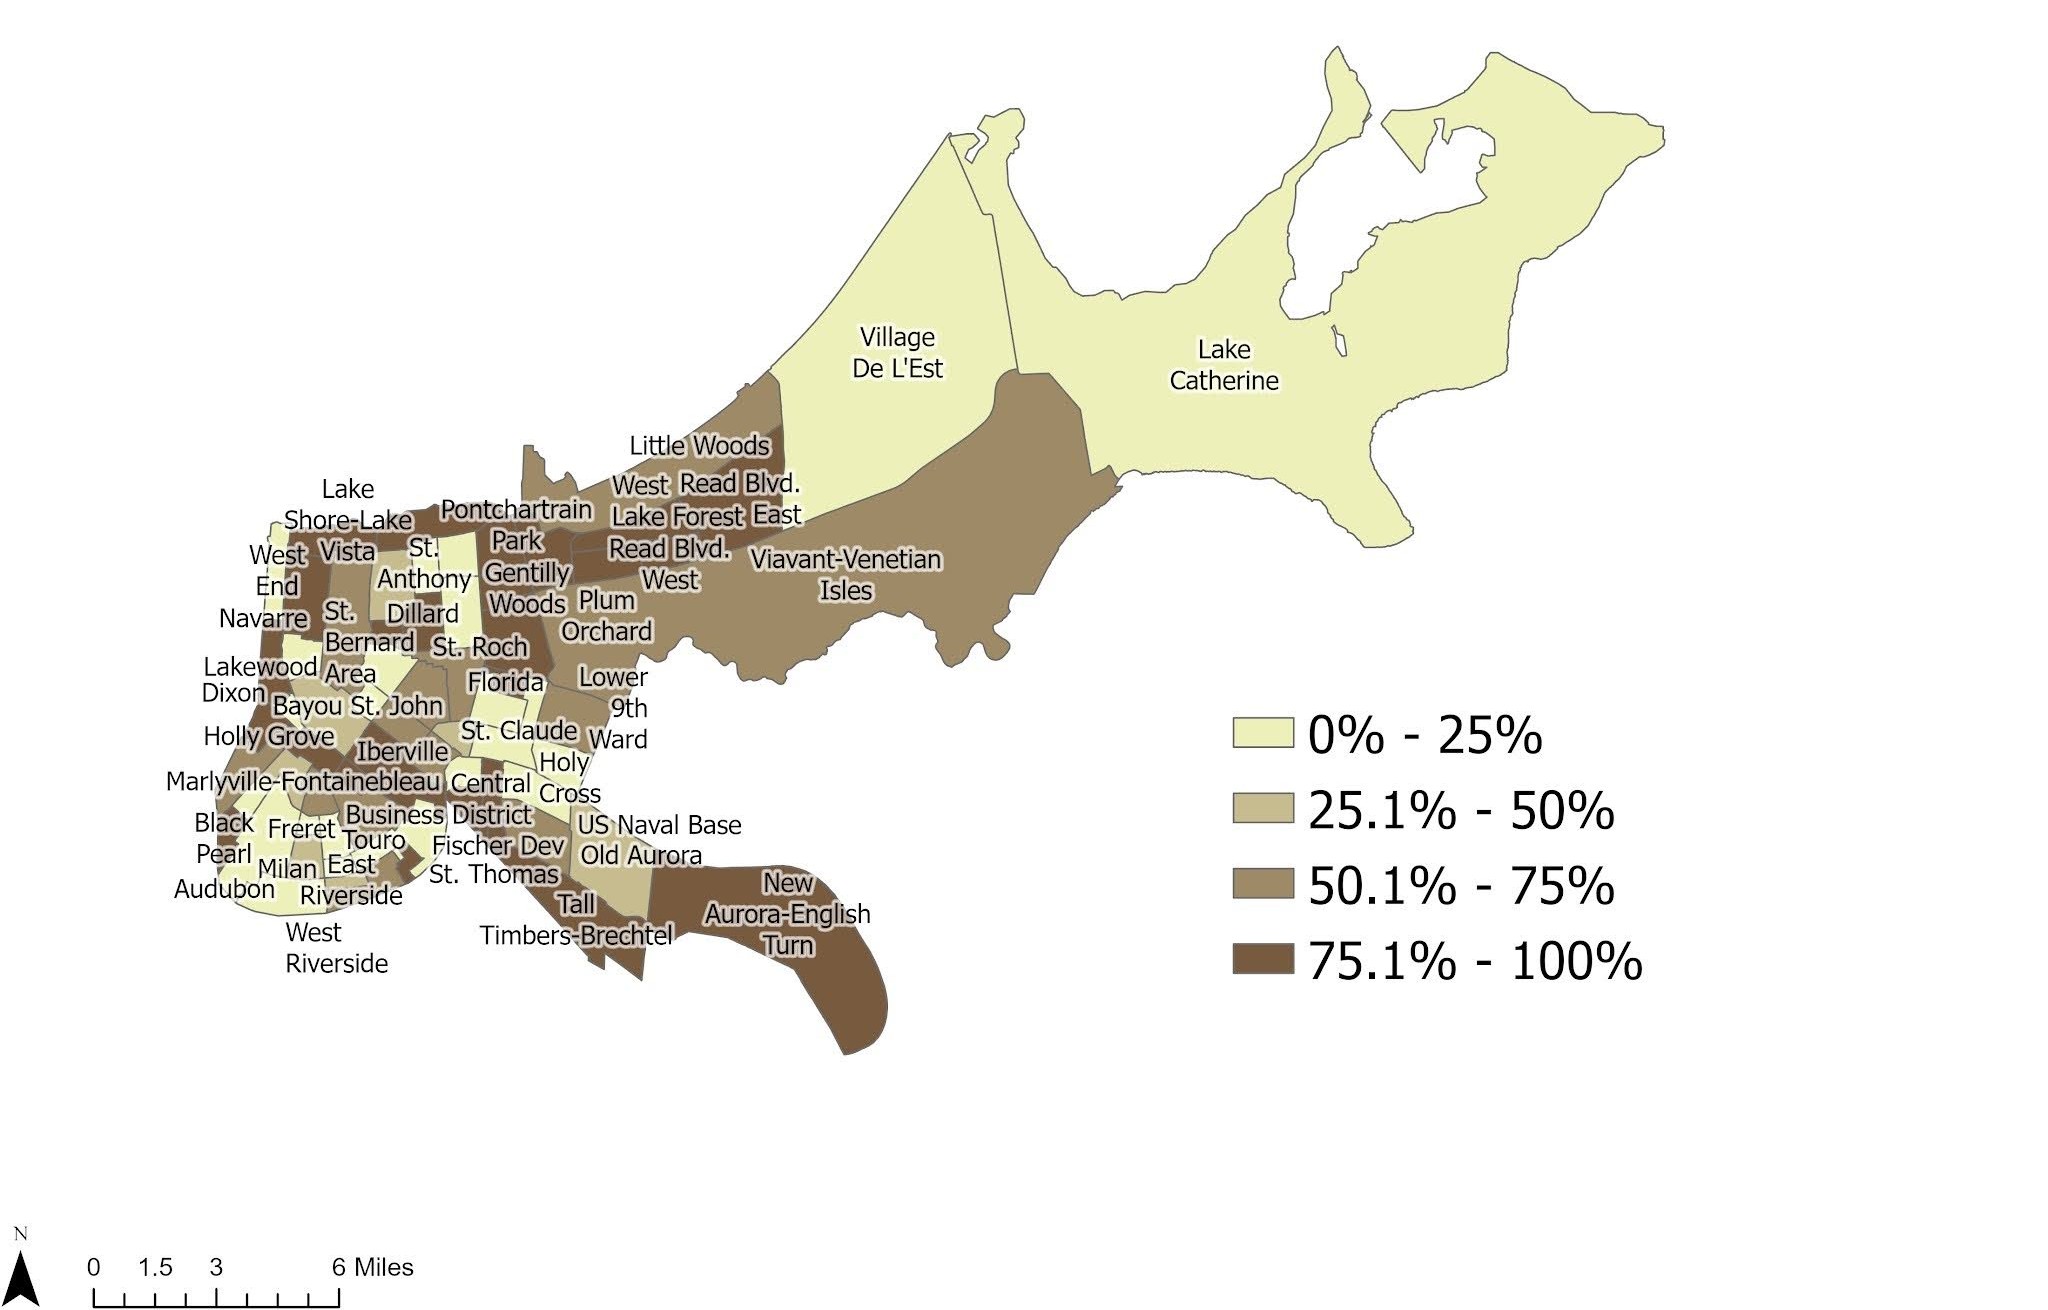
New Orleans, similar to the other two cities, had a wide distribution of sensitivity and lack of adaptive capacity, with a high proportion of vulnerability within the downtown areas. High exposure vulnerability was contained within the downtown neighborhoods, arguably more systemically than in Boston or Phoenix. Given that New Orleans has the highest proportion of population below poverty and non-white residents as compared to Boston and Phoenix, it is unsurprising to see that many neighborhoods (39%) are within the top quartile for lack of adaptive capacity. New Orleans, unlike the other cities, was missing data for some lack of adaptive capacity factors: utility insecurity and housing insecurity. This highlights the need for improved and consistently available data across all US cities.
Based on Figure 6, some identified frontline neighborhoods include Viavant-Venetian Isles, Business District, French Quarter, Central City, and Riverside.
The first challenge encountered in creating and mapping these indices was spatial data availability. There is much missing data on at-risk communities, such as those who are unhoused, people who use drugs, pregnant people, and indoor and outdoor workers, among others.
The second obstacle was that most data, outside of those sourced from the American Community Survey, are only available at the census tract level. Block groups are units of analysis smaller than census tracts, which are more ideal for accurately representing where populations are located. Due to missing data at the block group level, this analysis only includes and analyzes maps showing the census tract level.
More data at smaller scales such as block groups, along with data on invisible populations, are needed to assess the true risk of extreme heat in urban settings.
These maps show that exposure, sensitivity, and lack of adaptive capacity vulnerabilities can be found in most neighborhoods across the three cities studied, and policies should take into account this broad spatial distribution of heat-health risks. Although limited by publicly available data, maps like this can be useful to identify specific neighborhoods to target education and resource allocation. These maps can be used by policymakers and educators to identify those most at-risk to extreme heat given diverse vulnerabilities, and provide a new framework to understand vulnerability and frontline community identification. Data such as that shared by these maps can be used to support extreme heat resilience planning at both the community and city levels.
This analysis was performed by Naomi Frim-Abrams, with support from Talia Feldscher, Elaine Bertolini, and Patricia Fabian.