We want to hear from you! Share your story this summer.

One way to drive action when heat and other extreme weather events harm people and neighborhoods is to document impact. The Community Adaptations to City Heat (CATCH) team is collecting narratives, photos, stories, and experiences of communities in three cities to identify patterns, elevate local voices, and ultimately inform programming,drive policy, and accelerate solutions.

We’re inviting residents from greater Boston, New Orleans, and Phoenix
to share extreme heat stories this summer. 

How does it work?

This can be done easily by signing up for ISeeChange, which is always free.

If you are a resident... 

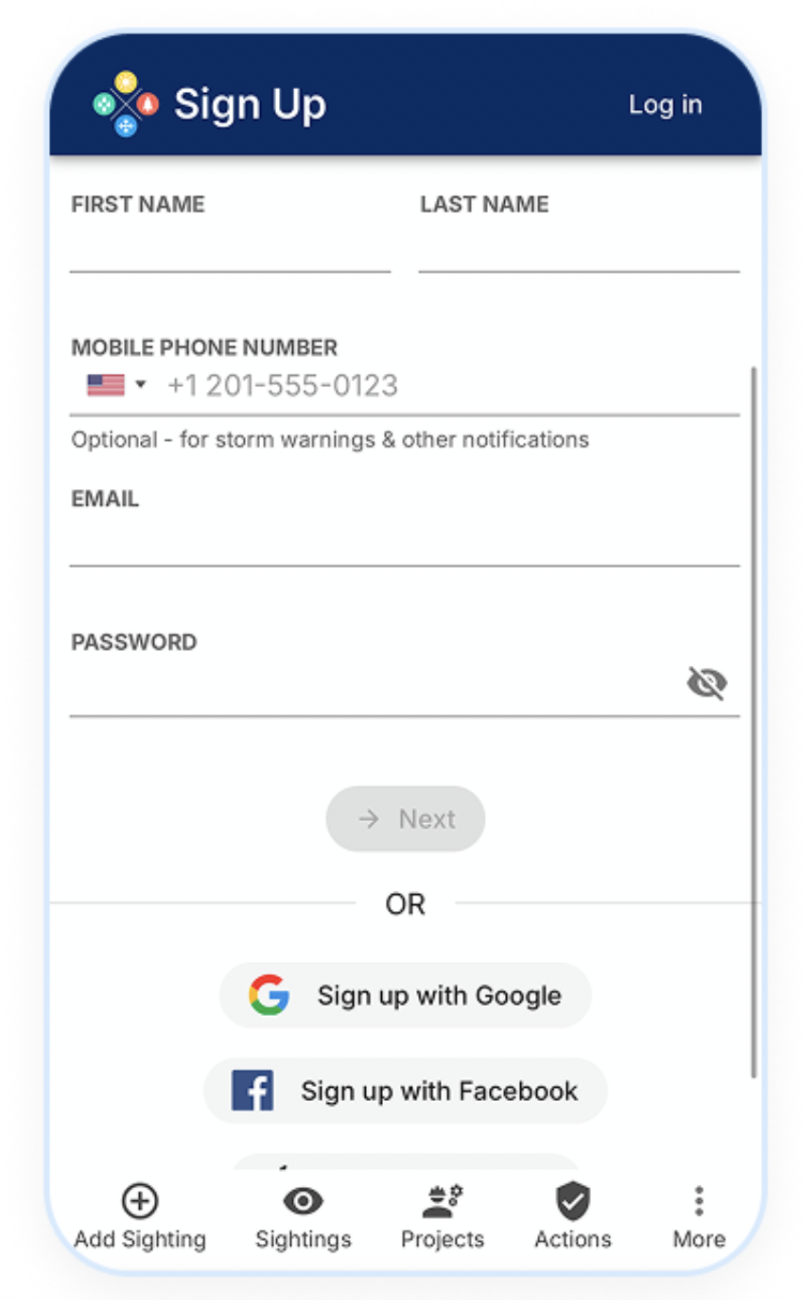
Participating can be done from just about anywhere—all you need to do is: 

1. Create an Account
  • Visit ISeeChange.com on your phone or computer, or download the app on your phone
  • Create an account with your email address or through a third-party login
  • Select ‘yes’ when asked if we can send your push notifications (we will use this to send real-time weather updates)
2. Post a Sighting
  • Click on “Add Sighting” 
to start sharing your experience, whether it’s about extreme heat or resources to help you stay cool
  • Include details such as:

  • A description of how extreme heat is impacting you, for example: soaring energy bills, transportation challenges, or health impacts 
  • A photo or video from a current or 
past event
  • When and where it happened

  • Any additional details or measurements, such as temperature or how heat is impacting how you feel
3. Engage with your Community
  • Explore posts from neighbors and others in your area on the sightings feed
  • Respond to comments and connect with others to ask questions, get updates from local officials, and share resources
  • Read community emails to stay up to date on weather and climate trends, local resources, and how you can help document extreme heat impacts 

If you are a Community Organization
or City Decision Maker...

We can set you up with a community account (free of charge).
  • For organizations interested in participating, simply reach out to ISeeChange to schedule a brief introductory call. 
  • The ISeeChange team will walk organizations through setting up a group account and activating the tools needed to begin collecting data.
  • Organizations will gain access to a centralized platform that makes it easy to track, manage, and map community-submitted extreme heat reports, turning local observations into a powerful resource for advocacy, planning, research, or community engagement.

CATCHing Stories:
Using ISeeChange to Understand Community-Level Impacts of Extreme Heat

ISeeChange is a free, community-driven platform that empowers you to document and share how extreme heat is affecting your neighborhood as well as resources that help keep you cool. ​​
Community Input

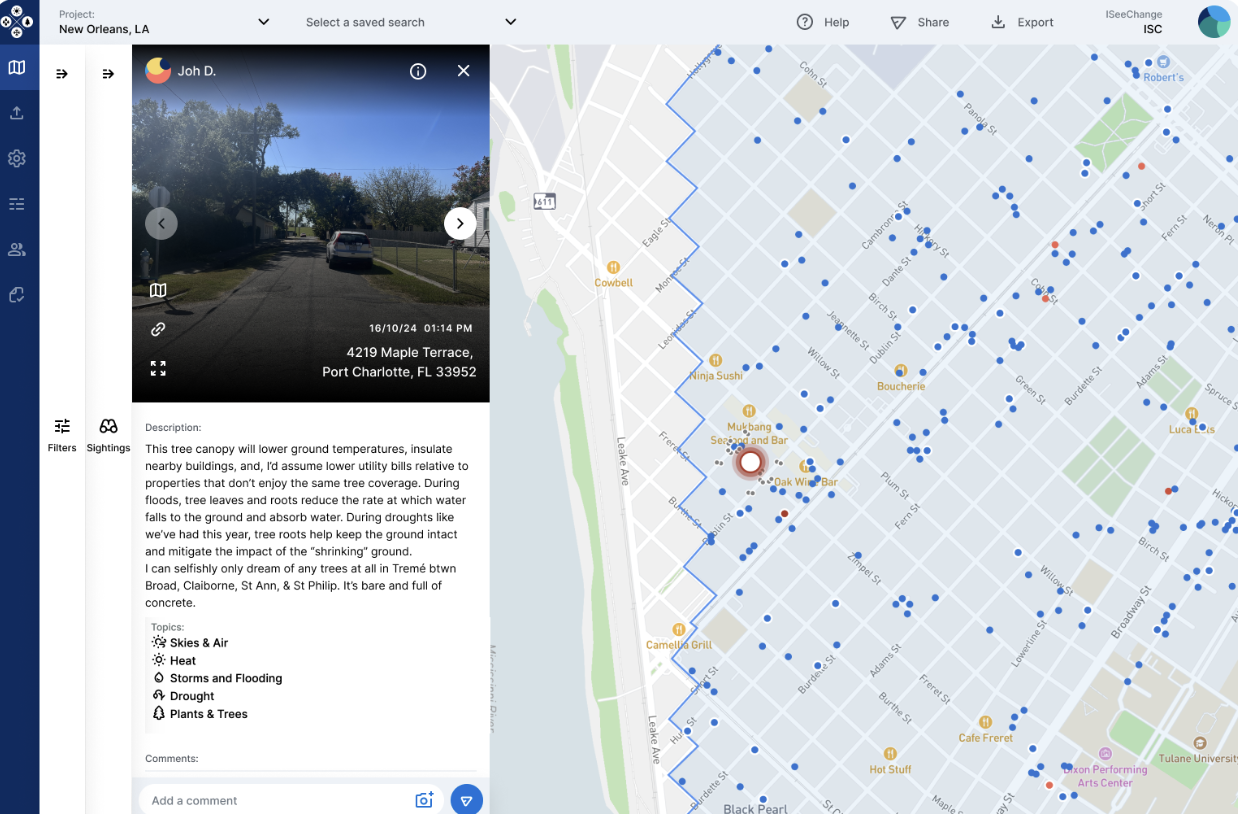
Participants using ISeeChange contribute observations about extreme heat, infrastructure, and other neighborhood conditions by sharing photos, videos, and descriptions to capture their experiences.

Data Analysis

Each observation is timestamped and geolocated, allowing researchers and community partners to see patterns across place and time. These reports are then layered with weather station data, to create a rich understanding of how environmental conditions vary across a city and how they impact residents.

Icon
Informed Data
The result is a dynamic, community-powered dataset that bridges the gap between scientific measurement and lived experience.
These on-the-ground community observations and reports – capturing everything from indoor temperatures to the presence or absence of shade, green space, and cooling resources – translate the human dimension of heat into tangible, place-based data. This lived experience data will allow the CATCH team to identify gaps, center equity, and advocate for interventions that are responsive to the communities most impacted.

WEB VIEW example:

A map of New Orleans displaying community-submitted environmental observations as points across the city.

Each dot represents a user report, showing where people are experiencing conditions like heat, flooding, or environmental stressors.

The selected point highlights a specific observation, including a photo, location, timestamp, and written description.

The example report discusses tree canopy and its impact on heat, flooding, and drought conditions in a neighborhood.

The shaded boundary outlines a specific area of focus within the city. Together, the map and individual report show how local, on-the-ground experiences are captured and visualized spatially.

An Example of How ISeeChange Worked in New Orleans

The Challenge:
The New Orleans Health Department must rapidly interpret heat and humidity data and communicate risks and protective actions to residents, while also shaping policy and investments. But most available data isn’t local enough—measurements are often taken far from where people, especially those most vulnerable, live and work. As extreme heat intensifies, health impacts will grow. More localized data and stronger community engagement are essential to respond effectively.

Outcomes and Applications of ISeeChange:

  • ISeeChange data helped establish and lower the City’s first ever indoor cooling standard, approved as part of the Healthy Homes Ordinance.
  • Documenting community health impacts, heat exposure, and energy burdens can help unlock additional federal funding, including programs like USDA Urban Reforestation and LIHEAP.
  • Developing recommendations for heat and humidity monitoring to be more reflective of underserved resident experiences.
  • Improved collaboration on targeted health and heat messaging across cities, researchers, utilities, and other stakeholders.
  • Neighborhood and resident level heat and health data being used to direct the city’s utility, Entergy, to target energy efficiency programs on low income neighborhoods.


We are a team of interdisciplinary researchers, students, and staff at the Boston University School of Public Health, working at the intersection of climate, health, and community resilience. Learn more about our team.