Making extreme Heat impacts visible

CATCH is working to:

Raise visibility

of the adverse impacts of extreme temperatures on health.

Design and deliver tools

for decision makers to quantify extreme heat impacts on health.

Icon
Create pathways

to connect siloed policies to improve heat-related exposure and health impacts on frontline communities.

Why heat in cities?

  • Urban areas experience higher temperatures than rural areas due to greater impervious surface area, low tree cover, and highly concentrated fossil fuel use. These factors contribute to the urban heat island (UHI) effect, with urban daytime temperatures measuring 1-6°F higher than surrounding rural areas.
  • Heat islands are areas dominated by pavement, buildings, and other surfaces that absorb and retain heat. UHI effects lead to increased energy costs (e.g., for air conditioning), air pollution, as well as heat-related illnesses and deaths.
  • Especially in urban contexts, vulnerability to extreme heat is strongly related to patterns of historic disinvestment. Historically redlined areas have higher proportions of low-income residents and residents of color, as well as higher mean land surface temperatures; this is observed across multiple US cities in different geographic regions . 
  • Frontline communities have “disproportionately carried the burden of harm from...economic disinvestment, under-investment, and [sociopolitical] disenfranchisement”.
  • Historically redlined areas, or areas that were designated by banks as unsuitable for lending based off of racial prejudice in the 1930s, tend to have less green space and more building complexes made of heat-absorbent materials, resulting in a deadly combination of “higher temperatures but lower access to cooling”. Residents in these areas are also less likely to be able to afford cooling technologies and other “coping mechanisms” for extreme heat such as air conditioning.
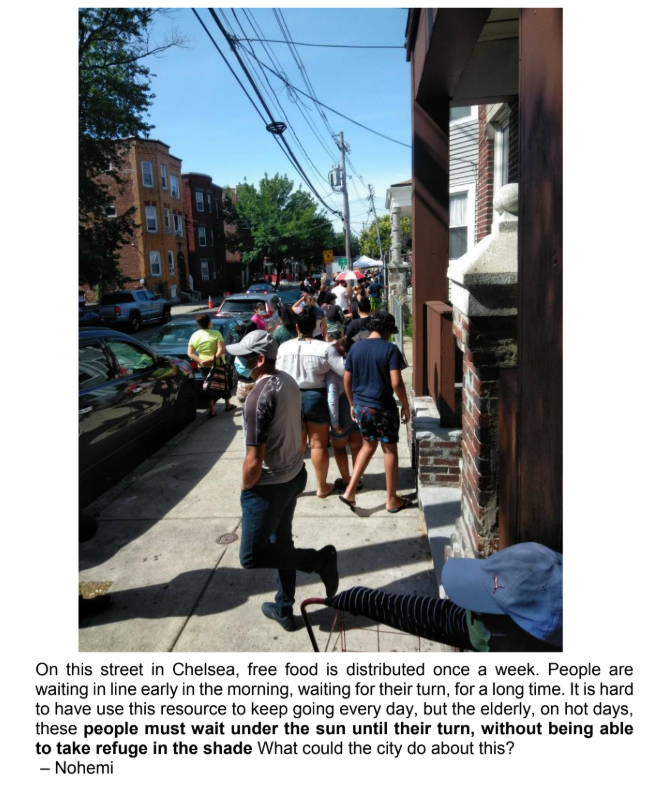
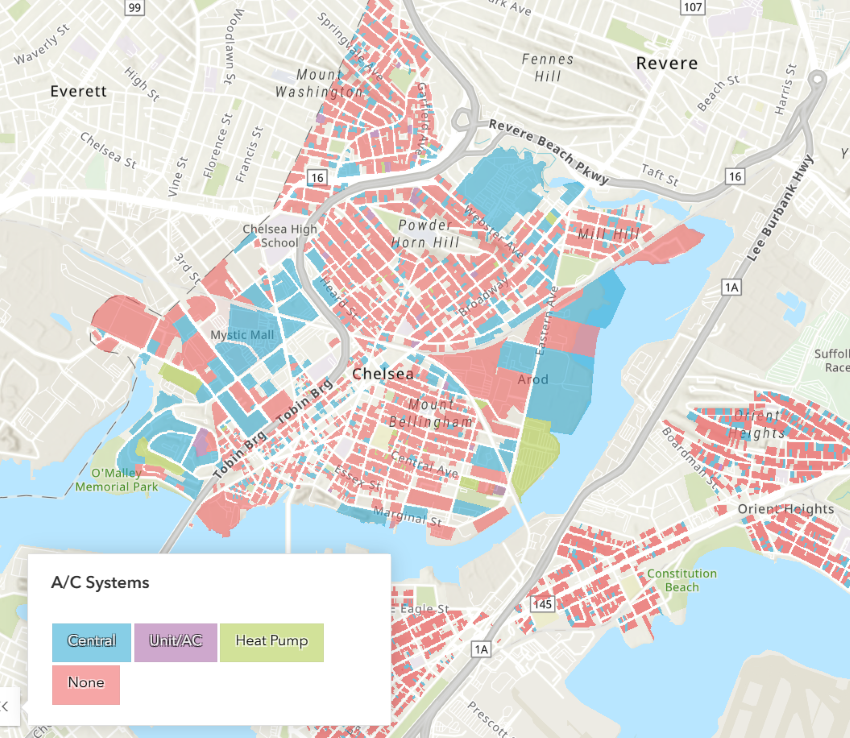
Frontline communities bear the first and worst impacts of climate change.

Why these three cities?

CATCH work currently focuses in Boston, New Orleans, and Phoenix. All three experience significant urban heat intensity and are in different climate zones, representing three different types of urban heat: 

Boston – A city experiencing increased heat, with building infrastructure designed to keep heat in during cold winters
Phoenix – A city that is extremely hot and dry almost year round
New Orleans – A city that is extremely hot and humid almost year round

Leaders in these cities have demonstrated strong commitment to climate action, energy efficiency, and environmental justice for vulnerable populations. Additionally, we have strong relationships with city and local organizations.

What We Do

Photo by Megan Jones, BUSPH
We share research, data maps, and stories.
  • Collecting, analyzing, and compiling data to understand impacts of extreme heat on health.
  • Creating models to understand impact of trees and white roofs on outdoor temperatures.
  • Quantifying effects of air conditioning and white roofs on indoor building temperatures.
  • Measuring temperatures indoors and outdoors.
  • Developing a database of extreme heat action plans and policies across cities.
  • Creating maps to identify city hotspots, AC prevalence, and more.
  • Understanding how urban heat islands impact emergency room visits and other health impacts.
Photo by Megan Jones, BUSPH
We create new information to support city and community decisions.
  • Engaging with frontline residents and communities to understand and elevate experiences, stories and priorities.
  • Identifying data gaps that require further investigation.
  • Supporting extreme heat workshops and campaigns to enhance awareness and education.
  • Creating synergies and connections across community members, city leaders, and policymakers.

Our Impact

Heat Adaptation and Policy Improvements
  • Elevating the lived experience of frontline communities to inform action.
  • Informing and improving city heat adaptation / resilience plans and decisions.
  • Identifying best practices, facilitating collaboration, and sharing knowledge across cities.

Examples of past and ongoing work

Community Engaged Research in Chelsea and East Boston, Massachusetts

The C-HEAT Study
A collaborative research study between GreenRoots and the Boston University School of Public Health.

Elevating resident experiences of extreme heat and adaptation measures with tools such as Photovoice and Iseechange

Left: A photo and writing by a local resident as part of the 2021 Photovoice project.

Modeling impact

This recent article examining the impacts of tree canopy expansion and cool roofs in Boston includes two CATCH members on its team of authors.
The paper models the impacts of trees and white roofs on ambient and indoor temperatures in a Boston neighborhood.

Mapping cooling infrastructure and energy costs at a building level

The C-HEAT Study
A collaborative research study between GreenRoots and the Boston University School of Public Health.

Left: A screenshot from the C-HEAT data dashboard

Measuring temperature to support decisions & policies


Left: PhD students and research staff take outdoor temperatures at a Boston-area park as part of The C-HEAT Study - a collaborative research study between GreenRoots and the Boston University School of Public Health.

BUSPH Photo by Megan Jones

Connecting researchers with practitioners & community based organizations

In June of 2024, the Metropolitan Area Planning Council (MAPC) and the Center for Climate and Health at Boston University School of Public Health collaborated on a symposium: "Fostering Collaborations: A Symposium to Advance Equitable Heat Health Actions", sponsored by the Doris Duke Foundation.

This symposium brought together 100+ stakeholders from 80+ institutions, including state and municipal government agencies, healthcare, community-based organizations, foundations, advocacy groups, and other universities to determine successes, areas of improvement, and gaps in Boston-area extreme heat research and policy.

BUSPH Photo by Megan Jones
Want a shareable document to provide to your communities and partners about who CATCH is and what we can offer?
Sources
  1. Shushi Peng, Shilong Piao, Philippe Ciais, Pierre Friedlingstein, Catherine Ottle, François Marie Bréon, Huijuan Nan, Liming Zhou, and Ranga B. Myneni. “Surface Urban Heat Island across 419 Global Big Cities.” Environmental Science and Technology 46 (2012): 696–703.
  2. M. Santamouris. 2014.Cooling the cities – A review of reflective and green roof mitigation technologies to fight heat island and improve comfort in urban environments. Solar Energy. Volume 103. May 2014 issue. 682-703. https://doi.org/10.1016/j.solener.2012.07.003
  3. Abdelatty, H., English, D., Garcia, A., Melgoza, S., & Mendoza, A. (2023). Turning Down the Heat: Addressing Heat Inequities of Frontline Communities in Los Angeles. https://escholarship.org/uc/item/8kr3h6jm
  4. Hsu, A., Sheriff, G., Chakraborty, T., & Manya, D. (2021). Disproportionate exposure to urban heat island intensity across major US cities. Nature Communications, 12(1), 2721. https://doi.org/10.1038/s41467-021-22799-5
  5. Rice, J. L., Long, J., & Levenda, A. (Eds.). (2024). Urban Climate Justice: Theory, Praxis, Resistance. University of Georgia Press.
  6. Wilson, B. (2020). Urban Heat Management and the Legacy of Redlining. Journal of the American Planning Association, 86(4), 443–457. https://doi.org/10.1080/01944363.2020.1759127
  7. Marx, R., & Morales-Burnett, J. (2022). Centering Equity to Address Extreme Heat. Urban Institute.
  8. Voelkel, J., Hellman, D., Sakuma, R., & Shandas, V. (2018). Assessing Vulnerability to Urban Heat: A Study of Disproportionate Heat Exposure and Access to Refuge by Socio-Demographic Status in Portland, Oregon. International Journal of Environmental Research and Public Health, 15(4), Article 4. https://doi.org/10.3390/ijerph15040640